

Real-time production monitoring systems: how they work and what benefits they deliver

Tomasz Węgrzyn
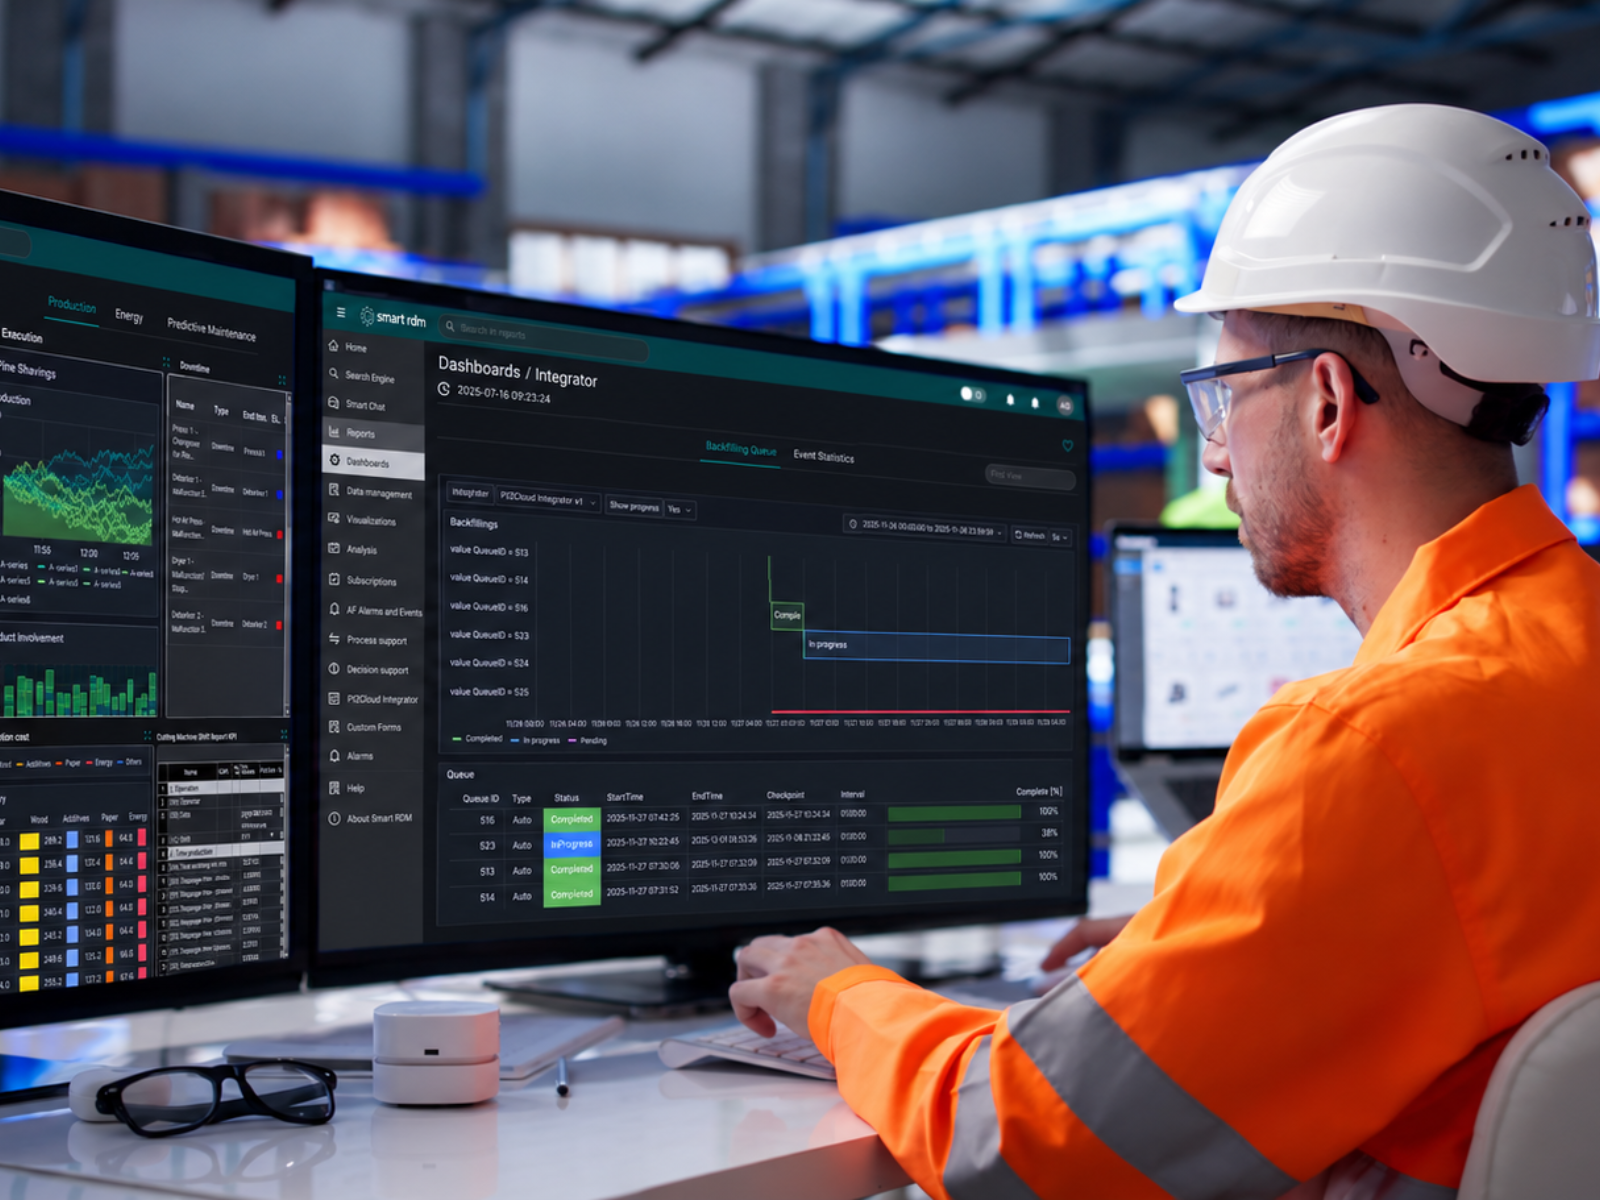
A production monitoring system collects, processes and visualises data from machines, lines and production processes in real time. Its purpose is continuous visibility of production: machine status, output, downtime, quality, cycle time and deviations from plan.
In many plants, production is only reviewed once the shift has ended – based on operator reports, spreadsheets, manually entered stoppage reasons or data pulled from several systems. That model makes fast response difficult, because the problem only becomes visible once the loss has already occurred.
A production monitoring system shifts the centre of gravity. Shop floor data reaches dashboards, alerts and reports closer to the moment when action is still possible. For a shift leader, that means a live picture of plan attainment. For a process engineer, data for loss analysis. For maintenance, context around stoppages and events. For senior management, a more reliable view of actual production performance.
This article explains what a production monitoring system is, which components it consists of, what data it collects, how it differs from MES and SCADA, what the architecture looks like, and how to approach implementation in a production environment.
What is a production monitoring system?
A production monitoring system – distinct from a broader production management system – is a solution for continuously collecting, structuring and presenting production datafrom machines, lines, workstations, operators and source systems.
It can run as a standalone solution, as a module of a larger MES, or as part of an industrial data platform. Its core role, however, is specific: to provide visibility into what is actually happening in production. Where that visibility includes progress against orders and shift targets, production tracking software helps teams connect machine activity with actual production output.
A typical production monitoring system answers questions such as:
- whether the line is running, stopped, in changeover or waiting for material;
- how many units have been produced against target;
- how many defects, rejects or scrap units occurred;
- what the current cycle time is;
- which machines generate the most downtime;
- what the most frequent stoppage causes are;
- whether production is meeting the plan for the shift, order or batch;
- when a deviation occurred and who should respond.
In practice the system combines several layers: shop floor data sources, data acquisition, edge or server-side processing, dashboards, alerts, reports, and integrations with MES, ERP, SCADA, CMMS or a data platform.
Production monitoring is not the same as full production management. It does not replace planning, routings, product genealogy or complete quality management. What it does provide is a layer of visibility and response: it shows what is happening now, where losses arise, and which data is needed for further analysis.
In the wider K5 architecture, production monitoring sits within the Manufacturing Performance area, because it supplies the data used to assess performance, losses, downtime and production execution.
Production monitoring vs MES vs SCADA
A production monitoring system focuses on visibility of production performance, MES manages production execution, and SCADA is used to supervise and control the process.
| Area | Production Monitoring System | MES | SCADA |
| Primary role | Live monitoring of production, statuses, output, stoppages and KPIs | Management of production execution, orders, routings, WIP, quality and traceability | Supervision, visualisation and control of the technological process |
| Typical data | Machine status, production counters, cycle time, downtime, defects, alerts | Orders, operations, materials, batches, operators, genealogy, quality, WIP | Process signals, alarms, trends, PLC values, device states |
| ISA-95 level | Most often between levels 2 and 3 | Level 3 | Level 2 |
| Users | Operators, shift leaders, engineers, production managers, CI teams | Production, quality, planning, logistics, operations management | Controls engineers, process operators, maintenance |
| Example of use | “Line 2 is 14% below target, main cause: micro-stops on the feeder” | “Order X is at operation Y, material Z consumed, batch is under inspection” | “Reactor temperature exceeded the threshold, alarm triggered” |
| Scope | Production monitoring and tracking | Broader production execution | Supervision and control |
| Relationship | Can be an MES module or a separate visibility layer | May include monitoring as part of its operational functions | Can be a data source for production monitoring |
MES – Manufacturing Execution System – is the broader production execution system. It covers operational scheduling, dispatching, production tracking, quality, traceability, work in progress and execution reporting. Production monitoring can be part of an MES, or a complementary tool where the organisation needs faster visibility of machine data.
SCADA – Supervisory Control and Data Acquisition – focuses on process supervision and control. It monitors process values, alarms and device states. Production monitoring can consume SCADA data, but interprets it in a production context: shift target, order, counters, stoppage reasons, losses and plan attainment.
The distinction matters when choosing a tool. A plant that needs full order management, genealogy and quality control may need an MES. A plant that primarily wants to see current downtime, output and line losses can start with a production monitoring system.
Key components of a production monitoring system
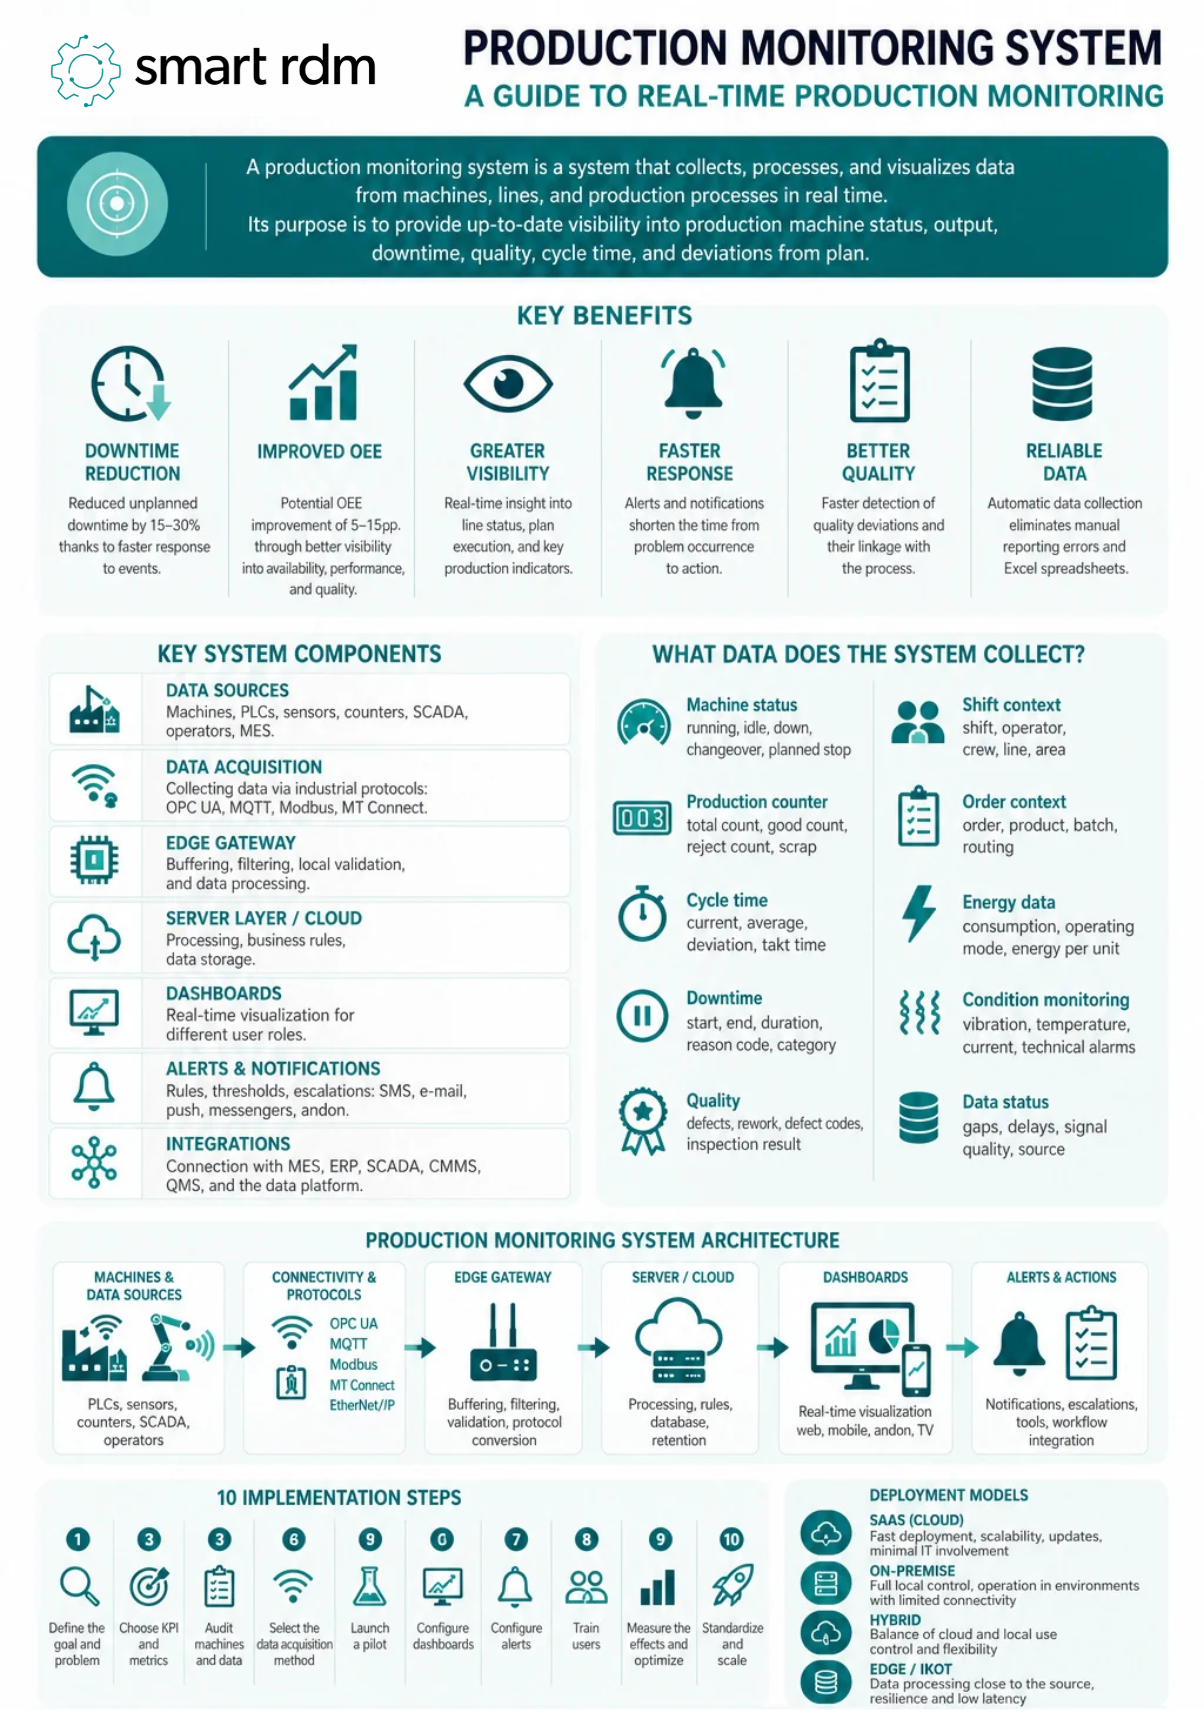
A production monitoring system usually consists of a machine data layer, acquisition, edge or server-side processing, dashboards, alerts and integrations with plant systems.
| Component | Function | Examples |
| Data sources | Provide signals about the state of production | PLCs, sensors, counters, SCADA, operators, MES |
| IoT sensors and data acquisition | Collect data from machines and processes | Vibration, temperature, pressure, current, optical and vision sensors |
| Connectivity and protocols | Transfer data to the layer above | OPC UA, MQTT, Modbus, MTConnect, EtherNet/IP |
| Edge gateway | Processes data close to the source | Buffering, filtering, local validation, protocol conversion |
| Server or cloud layer | Stores and processes production data | SaaS, on-premise, hybrid, edge-first |
| Dashboards | Present production performance | Shop floor screens, office view, mobile, TV, andon board |
| Alerting engine | Sends notifications and escalations | SMS, e-mail, push, messaging apps, andon, tasks |
| Integrations | Connect monitoring to other systems | MES, ERP, SCADA, CMMS, QMS, data platform |
IoT sensors and data acquisition
Data can come directly from PLCs, SCADA systems, machine counters, retrofit sensors or manual operator confirmations. In brownfield environments there is rarely one ideal acquisition method, because the machine park consists of assets of different ages, communication standards and signal availability.
Typical data sources include:
- machine operating status: run, idle, down, changeover, planned stop;
- counter of units produced;
- counters of good units and defects;
- cycle signals;
- alarms and events;
- process values: temperature, pressure, current, vibration;
- operator confirmations;
- stoppage reason codes.
Where a machine does not expose data via PLC or SCADA, retrofit sensors are used. They can detect a run signal, cycle, vibration, current draw, counter pulses or part presence. This approach makes it possible to monitor older machines without a full automation upgrade.
Dashboards and the visualisation layer
The dashboard is the presentation layer of a production monitoring system. It should show different information depending on the user’s role.
An operator needs a simple view: is the line meeting the plan, what is the current problem and what should be done. A shift leader needs a comparison of lines, stoppages and deviations. A production manager needs trends across shifts and days. Senior management needs headline indicators and exceptions. By linking these views to a shared set of production records, production tracking software helps each role follow progress without relying on separate spreadsheets.
Typical dashboard views include:
- production vs target;
- line status;
- run time and downtime;
- most frequent stoppage causes;
- cycle time trend;
- rejects and scrap;
- OEE as an output of monitoring data;
- drill-down: plant → line → machine → shift → order;
- operator, supervisor, manager and executive views.
A dashboard should be more than a good-looking screen. Its job is to shorten the time between a problem occurring and someone responding to it. That is why production monitoring systems often use digital andon boards – visual signals of a problem, a status or a need for support.
Detailed KPI dashboard design is a separate topic, covered in the article on the Manufacturing KPI Dashboard.
Alerts and notifications
The alerting engine is the reactive layer of a monitoring system. It detects events and deviations and routes them to the right people.
Examples of alerts:
- output falling below a threshold;
- downtime exceeding a set duration;
- a sudden increase in cycle time;
- a quality deviation;
- missing machine data;
- a missing stoppage reason code;
- a stoppage on a critical line;
- a shortfall against the shift target.
Alerts can be delivered via SMS, e-mail, push notifications, messaging apps, an andon screen or tasks in a workflow system. Escalation rules matter: operator → shift leader → manager → maintenance or quality.
Alert fatigue also has to be managed. If the system generates too many low-value notifications, users stop reacting. That calls for priorities, thresholds, suppression of repeat alerts, and a clear distinction between information, a warning and an event that requires action.
An alert can also trigger a work instruction. This is where monitoring meets Digital Work Instructions, although designing digital instructions remains a separate topic.
What data does a production monitoring system collect?
A production monitoring system collects data on machine status, production counters, cycle time, downtime, quality, orders, shifts, batches and the operating context of the line.
| Data type | Examples | What it is used for |
| Machine status | Running, idle, down, changeover, planned stop | Visibility of run time and stoppages |
| Production counters | Total count, good count, reject count, scrap | Tracking output and target attainment |
| Cycle time | Current cycle, average cycle, deviations, takt time | Identifying slowdowns and micro-stops |
| Downtime | Start, end, duration, reason code, category | Downtime and availability loss analysis |
| Quality | Defects, rejects, defect codes, inspection results | Linking quality losses to the process |
| Shift context | Shift, operator, crew, line, area | Comparing shifts and operational accountability |
| Order context | Order, product, batch, routing | Comparing plan against execution |
| Energy data | Consumption, operating mode, energy per unit | Energy monitoring in a production context |
| Condition monitoring data | Vibration, temperature, current, technical alarms | Support for maintenance and asset condition analysis |
| Data status | Gaps, latency, signal quality, source | Reliability of monitoring data |
Real-time production data
Real-time production data means data made available quickly enough to support action in the moment. In practice that does not always mean milliseconds. For one line, a dashboard refreshed every minute may be enough; for a fast-changing process, a far higher sampling rate may be required.
What matters is matching latency to the decision. If an alert is meant to help an operator respond to a drop in output, the information has to arrive during the shift. If the report supports weekly analysis, the timing requirements are different.
Downtime tracking
Downtime tracking is one of the main uses of a production monitoring system. It can be automatic, manual or hybrid. By linking stoppage records to production orders and shifts, production tracking software helps teams identify which delays have the greatest impact on output.
Automatic stoppage detection answers the question “when did the machine stop and how long was it down”. Manual or semi-automatic cause classification answers the question “why did the stoppage happen”.
Typical stoppage categories are:
- breakdown;
- changeover;
- material shortage;
- no operator;
- waiting for quality;
- planned stop;
- micro-stops;
- cleaning;
- adjustment;
- downstream blockage;
- no order;
Downtime analysis can be presented as a Pareto of causes, a trend across shifts or a per-machine view. Downtime data can also feed MTBF and MTTR – mean time between failures and mean time to repair.
OEE as an output of monitoring data
A production monitoring system can supply the data behind the OEE components: availability, performance and quality. There is no need to develop the OEE formulas inside the monitoring system – what matters is that the input data is complete, consistent and collected automatically wherever possible.
The indicator itself is discussed in detail in the article on OEE, with examples of production metrics in the article on Production KPI Examples.
Architecture: from the shop floor to the dashboard
A typical production monitoring architecture runs from machines and sensors, through an edge gateway or data acquisition layer, to a server, cloud, data platform and the visualisation layer.
Machine / PLC / sensor → edge gateway → local server or cloud → database / data platform → dashboard → alert / report / workflow
| Layer | Function | Example elements |
| Shop floor | Source of operational data | Machines, PLCs, sensors, counters, SCADA |
| Connectivity | Data capture and transmission | OPC UA, MQTT, Modbus, MTConnect, EtherNet/IP |
| Edge | Local processing and resilience | Gateway, buffer, validation, filtering, store-and-forward |
| Processing | Aggregation, logic, rules | On-premise server, SaaS, cloud, hybrid |
| Data layer | Retention and context | Database, historian, industrial data platform |
| Visualisation | User-facing visibility | Dashboard, HMI, TV, mobile, andon board |
| Action layer | Response to events | Alerts, escalations, tasks, digital instructions |
Edge, cloud, on-premise and hybrid
The deployment model depends on plant requirements, IT/OT infrastructure, security policy and the need to operate offline.
SaaS makes it easier to go live quickly, keep the system updated and scale across sites.
On-premise gives more control over the local environment and may be required in plants with limited connectivity or specific security requirements.
Hybrid combines local data collection and processing with central reporting, analytics or multi-site management.
Edge-first is useful where the system must remain locally resilient even when connectivity is disrupted.
The architecture should account for what happens when the connection is lost, a gateway fails, PLC data stops arriving, a signal format changes or transmission is delayed.
Integration with MES, ERP and a data platform
Production monitoring can exchange data with an MES in both directions. The MES supplies order, product, routing or batch context, while the monitoring system returns actual data: output, timing, stoppages and execution status. This exchange allows production tracking software to show which order is running, how much has been completed and where delays are accumulating.
ERP typically consumes aggregated data: production execution, plan versus actual, cost allocation, material consumption or data for settlement.
At greater scale, production monitoring requires a coherent data layer. An Industrial Data Platform can provide integration, contextualisation and sharing of data from multiple sources – without developing the full platform architecture within the scope of this article.
Benefits of real-time production monitoring
Real-time production monitoring shortens the time between a problem occurring and a response, and supplies the data needed to analyse losses, downtime, quality and plan attainment.
The benefits most commonly expected include:
| Area | Potential effect | Mechanism |
| Downtime | Reduction of unplanned downtime by 15–30% in projects well matched to the problem | Faster stoppage detection, escalation, root-cause analysis |
| OEE | OEE improvement of 5–15 percentage points as a business hypothesis for selected environments | Better data on availability, performance and quality |
| Operational response | Shorter time to identify a problem | Dashboards, andon, alerts and role-based views |
| Quality | Faster detection of quality deviations | Linking defects to machine, order, shift and parameters |
| Reporting | Less manual data collection | Automated counters, statuses and stoppage codes |
| CI | Better data for kaizen and improvement activities | Before/after measurement, trends, Pareto of losses |
| Costs | Better attribution of losses and costs | Actual data for planning, production, maintenance and finance |
These figures are best treated as assumptions for a business case rather than a guaranteed outcome. The actual effect depends on data quality, implementation scope, operational discipline, how the team responds, and whether monitoring actually leads to action.
Faster problem identification
When data is visible in real time, the team can recognise a stoppage, a drop in output, a cycle deviation or recurring micro-stops sooner. That does not deliver improvement automatically, but it creates the conditions for a response.
For example: if a line runs 12% below target for the first two hours of a shift, the system can surface the problem while the shift is still running. Without monitoring, that information may only appear in the end-of-shift report.
Data for continuous improvement
Production monitoring supplies data for CI – continuous improvement. Teams can compare the situation before and after a change, review downtime trends, analyse losses by cause and set better priorities.
Monitoring does not replace optimisation methods. Monitoring data can, however, feed Process Optimization, where decisions are made about which process changes are justified.
Data for operational decisions
Monitoring data can support decisions taken by shift leaders, maintenance, quality, planning and production. In that sense monitoring is one input to a Decision Support System, but it does not replace the full decision layer.
How to implement a production monitoring system
Implementing a production monitoring system should start by defining the decisions and KPIs it must support, and only then move on to selecting sensors, dashboards and tooling.
| Step | Action | Outcome |
| 1. Define the objective | Identify the problem: downtime, output, quality, reporting, micro-stops | A clear use case and a business owner |
| 2. Select KPIs | Agree a minimum set: output, downtime, cycle time, scrap, OEE components | Agreed definitions and measurement methods |
| 3. Audit the machines | Review PLCs, SCADA, signals, counters and data availability | A map of data sources and gaps |
| 4. Choose the acquisition method | PLC, SCADA, retrofit sensors, operator input, integrations | A data capture design |
| 5. Run a pilot | Select one line, area or machine family | Verification of data and users |
| 6. Configure dashboards | Views for operators, leaders, engineers and managers | A visualisation and response layer |
| 7. Configure alerts | Thresholds, escalations, channels, priorities | Response to events |
| 8. Train users | Operators, leaders, maintenance, engineers | A consistent way of working with data |
| 9. Measure the effect | Compare results against the baseline | A business case for scaling |
| 10. Scale | Standardise data models, naming, roles and dashboards | Roll-out to further lines |
Start with a single problem
The best starting point is not “which tool should we buy?” but “which decision are we trying to improve?”.
Typical starting points include:
- stoppages detected too late;
- no reliable stoppage reason codes;
- manual production reporting;
- gaps between plan and execution;
- no visibility of micro-stops;
- deteriorating cycle times;
- no data to support OEE discussions;
- maintenance response times that are too long;
- unclear sources of scrap.
Build a baseline
Before implementation it is worth capturing the current state: how long reporting takes, how much downtime occurs, how complete the data is, how long a response takes, which machines cause the most problems, and which data is already available automatically.
Without a baseline it is hard to assess the effect of implementation. Monitoring may look visually impressive, but its business value comes from whether it shortens response time, reduces losses or improves the reliability of decisions.
Pilot first, then scale
A pilot should be narrow enough to deliver in a controlled way, yet significant enough for the result to matter to the plant.
A good pilot scope might be:
- a single production line;
- a single machine area;
- a single product family;
- a single loss type, for example downtime;
- a single shift reporting process.
After the pilot, standardise signal names, stoppage codes, dashboard views, alert thresholds, user roles and integrations. Scaling without standards leads to many local variants of monitoring that are hard to compare and maintain.
Retrofitting monitoring on older machines
Production monitoring can also be deployed on older machines, provided PLC signals, counters or external sensors are available, or retrofit sensors can be fitted non-invasively.
In brownfield environments, older machines often lack modern interfaces, documentation is limited, and controllers cannot always be modified. That does not make monitoring impossible.
Typical retrofit approaches:
- reading a signal from the existing PLC;
- pulling data from SCADA;
- fitting a current sensor to detect machine operation;
- a vibration sensor to detect state and cycle;
- an optical sensor to count units;
- a signal taken from the stack light;
- manual assignment of the stoppage reason by the operator;
- a local edge gateway that collects data without interfering with control logic.
The distinction between monitoring and control is important. A retrofit production monitoring project should interfere with machine operation as little as possible. The goal is to collect data on machine state and production, not to change control logic without a proper automation design.
Production monitoring software – the 2026 vendor landscape
The production monitoring software market spans MES systems, IIoT platforms, no-code tools, combined hardware and software solutions, OEE tracking systems and shop floor data collection applications.
| Vendor | Positioning | Typical context |
| Plex / Rockwell Automation | Cloud-based production monitoring as part of a smart manufacturing platform | Organisations looking for a broader production environment and MES |
| DELMIAWorks / SolidWorks / Dassault | Shop floor data collection within a manufacturing ERP | Manufacturers needing plant data integrated with ERP |
| 42Q | Cloud MES with production monitoring modules | Companies seeking monitoring as part of a cloud MES |
| Tulip | No-code platform for production monitoring and connected worker | Teams building operational applications without classic development |
| Vorne XL | Dedicated production monitoring and OEE tracking in a hardware plus software model | Plants focused on line monitoring and loss visualisation |
| Evocon | Production monitoring SaaS with automated data acquisition | Companies deploying fast monitoring on selected lines |
| MachineMetrics | Industrial IoT platform for machine monitoring and production tracking | Plants with CNC machines needing automated data collection |
| LeanWorx | OEE and production monitoring for CNC machines | Machining environments and discrete manufacturing |
| Factbird | Real-time production monitoring with plug-and-play sensors | Companies looking for a simple start on existing machines |
| Matics | Real-time manufacturing intelligence platform | Organisations combining monitoring with operational analysis |
| Smart RDM | Industrial data monitoring, workflow, dashboards and operational context | Industrial organisations needing monitoring, data integration and action management |
This is not a ranking. The right choice depends on whether the organisation needs a full MES, simple line monitoring, ERP integration, no-code applications, support for older machines, dashboards, workflow, or a broader data platform.
Production monitoring in the wider Smart RDM stack
Production monitoring is a layer of visibility and operational data that connects to other areas: OEE, KPIs, dashboards, analytics, maintenance, energy, the data platform and digital instructions.
Monitoring data can feed Production Analytics, although production analytics is a separate topic in its own right. Monitoring answers the question “what is happening now?”, while analytics helps explain trends, relationships and causes.
Production monitoring supplies data for OEE and KPIs, but the indicators themselves are discussed in detail in the articles on OEE and Production KPI Examples.
Condition monitoring data such as vibration, temperature, current or technical alarms can support Predictive Maintenance, although predictive models and PdM strategy are outside the scope of this article.
Energy monitoring can be one type of production monitoring where energy consumption is analysed in the context of machines, orders and operating modes. That topic is covered more broadly under Energy Management.
Monitoring alerts can trigger operational actions, checklists or instructions. Here monitoring connects with Digital Work Instructions and digital operational work, but it does not replace knowledge management.
Excel, spreadsheets and manual reports – when do they stop being enough?
Excel and shift spreadsheets can be enough at the start, but they become a constraint once the organisation needs real-time data, multiple lines, consistent stoppage codes and fast response.
A spreadsheet can work when:
- the plant monitors a single line;
- data is needed once a day;
- the number of events is small;
- there is no need for alerting;
- the goal is a simple report rather than a response during the shift.
A spreadsheet stops being enough when:
- reporting takes up a lot of time;
- stoppage reasons are entered after the fact;
- data differs from shift to shift;
- there is no visibility while production is running;
- the manager learns about a problem only after the shift ends;
- the number of lines and machines is growing;
- integration with MES, ERP or SCADA is required;
- alerts, dashboards and an auditable history are needed.
Moving from spreadsheets to a production monitoring system should not start by replicating the current report one-for-one. It is better to first establish which data is genuinely needed for decisions, and which losses need to become visible sooner.
FAQ
What is a production monitoring system?
A production monitoring system is a system for collecting, processing and visualising production data in real time.
It covers data from machines, PLCs, SCADA, sensors, operators and production systems. It shows line status, output, downtime, cycle time, quality, alerts and progress against the production target.
What is real-time production monitoring?
Real-time production monitoring means monitoring production quickly enough for the data to support action in the moment.
In practice that may mean a refresh every few seconds, every minute, or another interval matched to the process. What matters is that information about a stoppage, a drop in output or a deviation is available during the shift, not only after it ends.
How does production monitoring differ from process monitoring?
Production monitoring focuses on the result of production: output, downtime, plan attainment, cycle time, defects and KPIs.
Process monitoring focuses on process parameters: temperature, pressure, flow, level, recipe, alarms and technological conditions. In practice both areas may draw on the same data, but they answer different questions.
What are the four types of monitoring in manufacturing?
The four practical types of monitoring are:
- production monitoring – output, line status, plan versus execution;
- quality monitoring – defects, rejects, inspections, deviations;
- machine condition monitoring – alarms, vibration, temperature, current;
- energy monitoring – energy consumption, utilities, energy per unit produced.
These types can run within a single system, but each requires different data, rules and users.
What are the five types of production systems?
The types most commonly distinguished are project (one-off), batch, mass, process batch and continuous production.
A monitoring system should be matched to the production type. In discrete manufacturing, counters, takt, cycle and downtime matter most. In process manufacturing, process parameters, stability, batches, recipes and technological deviations carry more weight.
How do you monitor a production process?
To monitor a production process, define the objective of monitoring, select the KPIs, review the available data sources, choose the acquisition method, configure dashboards and alerts, train users, and compare results against the baseline.
It is best to start with a single line or a single problem – for example downtime, output or shift reporting.
What data does a production monitoring system collect?
The system collects, among other things, machine status, units produced, good units, defects, scrap, cycle time, downtime, reason codes, shift, order, batch, operator, alarms and event timestamps.
In more advanced deployments it can also collect energy data, condition monitoring data and signal quality status.
Which protocols are used in production monitoring?
The most commonly used are OPC UA, MQTT, Modbus, MTConnect, EtherNet/IP and machine builders’ proprietary interfaces.
The choice of protocol depends on the machine type, controller, available data, real-time requirements and the IT/OT architecture.
Does a production monitoring system replace an MES?
Not necessarily. A production monitoring system can be an MES module, part of a data platform, or a separate system that complements the MES.
An MES manages production execution, orders, traceability, quality and WIP. Production monitoring focuses on live visibility of line data, stoppages, output and alerts.
Can Excel be used for production monitoring?
Excel can be useful at a very early stage, but it is not a good tool for real-time production monitoring.
A spreadsheet does not provide automated data collection, alerting, consistent stoppage coding, machine integration or the ability to respond during a shift. It can be a starting point for defining a report, but it does not replace a monitoring system.
Which KPIs should a production monitoring system track?
Most often it tracks output, plan versus execution, run time, downtime, stoppage causes, cycle time, defects, scrap, OEE components, shift attainment and order status.
Detailed KPI examples are a separate topic, covered in the article Production KPI Examples.
What is the ROI of a production monitoring system?
ROI depends on the scale of losses, data quality, how the organisation responds and the scope of implementation.
Business cases often examine reduced downtime, lower scrap, less manual reporting, improved OEE, faster problem diagnosis and better use of resources. Pilot projects sometimes assume payback within 3–12 months, but that assumption should come from the plant’s own data.
Sources
- ISA-95 – the model for integrating enterprise and control systems.
- MESA International – materials on MES and the functions of manufacturing operations systems.
- Industry 4.0 frameworks – context for data integration, monitoring and manufacturing digitalisation.
- McKinsey – reports on manufacturing digitalisation and operational efficiency improvement.
- Deloitte – reports on smart manufacturing, the connected factory and operational monitoring.

Light mode