
Manufacturing analytics: data to decisions (2026)

Gabriela Gic-Grusza

In Brief
Manufacturing analytics is the use of data analysis tools and techniques to turn industrial data into operational decisions. In practice, it combines data from IIoT sensors, MES, SCADA, ERP, CMMS, historians, operator input, and external feeds to support four classes of analytics: descriptive, diagnostic, predictive, and prescriptive. It is commonly used to monitor KPIs such as OEE, throughput, scrap, downtime, MTBF, MTTR, and cost per unit, and to deliver outputs through dashboards, alerts, reports, ad hoc analysis, and embedded applications.
What is manufacturing analytics?
Manufacturing analytics is the application of data analysis to information generated in industrial environments so teams can understand what happened, why it happened, what is likely to happen next, and what action should be taken. In operational terms, it uses machine, process, operational, and system data to manage and optimize production, quality, maintenance, energy, and supply-chain decisions.
The term is broader than a single dashboard or report. It covers manufacturing data analytics, manufacturing data analysis, analytics for manufacturing, and analytics in manufacturing across real-time, batch, and historical contexts. It also spans multiple consumption modes: a manufacturing analytics dashboard for operators and managers, manufacturing analytics software embedded in ERP or MES, and manufacturing analytics tools used by data analysts for ad hoc work in Excel, SQL, BI tools, or specialized apps.
For Smart RDM, the category is best understood as a decision layer built on governed industrial data. Smart RDM describes itself as a central analytical platform that combines real-time OT/IT integration, a central data repository, big data analytics, AI/ML, dashboards, reporting, event handling, and AI-powered knowledge management in one environment.
The 4 types of analytics in manufacturing
Manufacturing analytics is usually organized into four classes: descriptive, diagnostic, predictive, and prescriptive. This is the cleanest way to explain how analytics moves from reporting to decision support.
- Descriptive analytics answers the question what happened. It uses aggregation, reports, and dashboards to summarize historical performance, trends, and KPI status. In manufacturing, this includes OEE trends, downtime history, scrap by line, throughput by shift, and work-center load. Descriptive analytics is the foundation for the other layers because diagnostic work depends on reliable visibility into past and current performance.
- Diagnostic analytics answers the question why did it happen. It uses drill-down analysis, correlation analysis, root cause analysis, and comparison across time, asset, product, shift, or location. In practice, this is where teams move from “scrap increased” to “scrap increased mainly on line 3, on night shift, for one SKU, after a recipe change.” Diagnostic analytics is the layer that usually comes after descriptive analytics and before predictive modeling.
- Predictive analytics answers the question what is likely to happen. It uses regression, classification, time-series forecasting, anomaly detection, remaining useful life logic, and other ML/AI models to estimate probability, risk, or future states. In manufacturing predictive analytics, common outputs include failure alerts, demand forecasts, quality risk estimates, and projected energy anomalies.
- Prescriptive analytics answers the question what should we do. It uses optimization, simulation, decision rules, and sometimes reinforcement-learning-style approaches to recommend actions or automate responses. In manufacturing, this can mean recommending process parameter changes, sequencing choices, energy-balancing decisions, or generating action paths for operators and maintenance teams.
KPIs and metrics: OEE, throughput, scrap, downtime, cost
Manufacturing analytics becomes operationally useful when it is tied to clearly defined KPIs. ISO 22400 is one of the most important reference points here because it defines KPIs for manufacturing operations management and describes their formulas, units, user groups, and time behavior.
The most widely recognized manufacturing KPI is OEE, or Overall Equipment Effectiveness. OEE is calculated as Availability × Performance × Quality. In practice, manufacturers use signals such as run/stop states, counts, speed losses, and scrap to derive OEE and its components. ISO 22400 defines KPI structures for manufacturing operations management, while SEMI E10 and related SEMI metrics standards provide a common language for equipment states, availability, reliability, maintainability, utilization, and productivity measurement.
Beyond OEE, manufacturing analytics should cover a broader KPI set. That typically includes throughput, cycle time, takt time, scrap rate, first pass yield, defect rate, planned and unplanned downtime, MTBF, MTTR, schedule adherence, on-time delivery, cost per unit, energy per unit, capacity utilization, work center load, inventory turns, and WIP. Different roles care about different subsets of these metrics: operators care about shift-level status, plant managers care about line and site performance, maintenance teams care about downtime, MTBF, and MTTR, while COO and CFO roles care more about cost, adherence, margin, and utilization.
Smart RDM fits naturally into this model because it already emphasizes KPI visibility, real-time dashboards, recurring and event-driven reporting, and analysis across quality, production, maintenance, and energy. That makes it suitable not only for descriptive monitoring but also for cross-role KPI management.
Data sources and pipeline: from raw signals to decisions
Manufacturing analytics depends on source diversity. The main data sources are IIoT sensors, MES, SCADA, historians, ERP, CMMS, operator input, vision systems, and external feeds such as weather, market, or supplier signals. Each source contributes a different part of the operational picture.
IIoT sensors provide raw telemetry such as temperature, vibration, pressure, current, flow, and machine-state signals, often via OPC UA, MQTT, or Modbus. These streams may arrive at millisecond-to-second frequency and are often routed into SCADA, historians, or directly into industrial data platforms.
SCADA sits at ISA-95 Level 2 and provides real-time process tags and operational telemetry. MES sits at ISA-95 Level 3 and contributes work orders, execution status, scrap, genealogy, and production context. ERP sits at ISA-95 Level 4 and contributes BOMs, suppliers, inventory, order structures, and cost data. CMMS provides asset history, maintenance events, and work orders, which makes it essential in predictive maintenance loops. Historians provide long-retention, tag-based time series, with products such as PI, AVEVA, and Canary often used in practice.
A typical analytics pipeline therefore looks like this: ingestion → storage and modeling → analytics → consumption. Smart RDM describes a very similar flow in its own platform logic: connect data from automation, PI/SCADA, meters, business systems, and external sources; normalize names, units, and structures; validate and govern data in the central repository; and finally use the result for dashboards, reports, event management, ESG reporting, analytics, and AI.
Reference architecture: stream, batch, edge, consumption
Manufacturing analytics works best when it supports real-time, batch, and edge processing instead of forcing everything into one mode. Real-time manufacturing analytics is needed for operator visibility, anomaly detection, and faster-than-shift decisions. Batch and historical processing are needed for KPI rollups, trend analysis, model training, cost analysis, and cross-site benchmarking. Edge processing matters where latency, resilience, or on-prem constraints apply.
The storage layer is often implemented with a data warehouse or lakehouse pattern. Embedded ERP analytics, cloud data platforms, and industrial analytics tools all use different variants of this idea, but the goal is the same: make raw and curated industrial data available for reports, dashboards, ML models, and applications. Smart RDM’s architecture is consistent with that pattern because it combines streaming and relational storage, governance, analysis, and reporting in one environment.
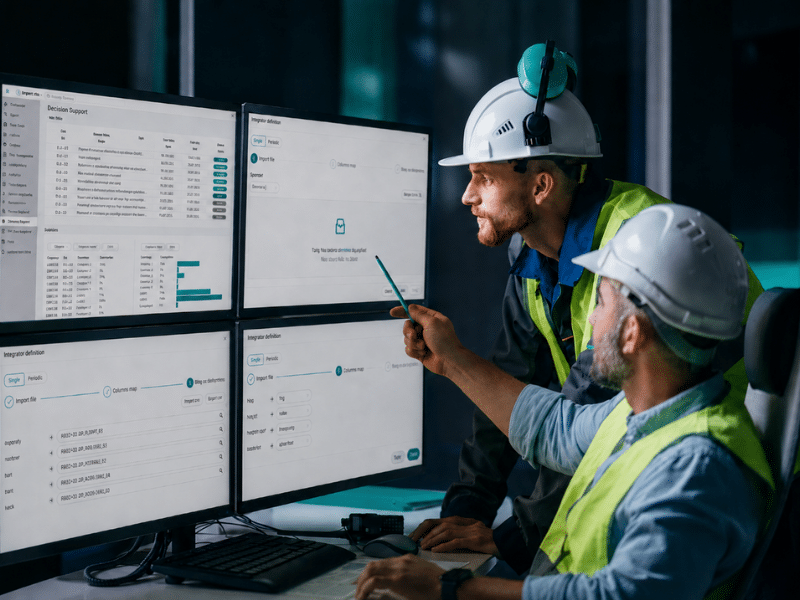
On the consumption side, manufacturing analytics usually delivers data to dashboards, Power BI-style reports, alerts, natural-language query, Excel or SQL-based ad hoc analysis, and embedded apps. Smart RDM explicitly supports dashboards, recurring and event-triggered reports, AI-assisted knowledge access, and operational decision support, which places it closer to a manufacturing analytics platform than to a narrow BI reporting add-on.
Personas and decision flows
Manufacturing analytics should not be designed as one universal view for everyone. The same data supports different decisions depending on the persona, and that is one reason persona-based analytics appears in Microsoft’s manufacturing analytics materials.
For the line operator, analytics is usually immediate and local. The key questions are whether the line is stable, whether the machine is within expected behavior, whether scrap or downtime is rising, and what action is needed now. The most useful outputs are current KPIs, alerts, shift context, and short action recommendations.
For the plant manager, the decision flow is broader. The key questions are whether the plant is meeting throughput, OEE, quality, schedule adherence, and energy targets, and where losses are concentrated by line, shift, product, or center. The most useful outputs are roll-up dashboards, drill-down analysis, and prioritized exceptions.
For COO, CFO, and cross-functional leaders, analytics is less about one machine and more about enterprise-wide trade-offs. Here the key questions include cost variance, margin impact, capacity utilization, inventory turns, and whether operational decisions are improving productivity and profitability at scale. McKinsey frames manufacturing analytics precisely in this broader productivity-and-profitability context.
Use cases: where manufacturing analytics creates value
Manufacturing analytics matters because one governed data layer can support multiple use cases without rebuilding integration each time. The most common use cases are predictive maintenance, quality analytics, process optimization, demand forecasting, energy and sustainability analytics, workforce and safety analytics, supply chain analytics, and cost or margin analytics.
Predictive maintenance uses vibration, temperature, current, runtime, and historian tags as inputs, applies anomaly detection and RUL logic, and produces alerts and work orders. In a strong architecture, the analytics layer triggers or enriches action in CMMS rather than stopping at a score. Smart RDM already positions predictive maintenance as a governed flow from data and models to operational action.
Quality analytics and manufacturing defect analysis combine process parameters, inspection results, and line images to detect root causes, classify defects, support SPC, and reduce recall risk. Computer vision is especially important here because vision systems add a high-value analytics layer on top of process data and MES context.
Process optimization uses setpoints, recipes, output, and energy data to recommend better operating parameters. This is where advanced manufacturing analytics starts moving from descriptive and diagnostic work into predictive and prescriptive decision support. Smart RDM’s manufacturing pages explicitly describe what-if reasoning, predictive quality, and optimization of OEE, quality, and cost.
Demand forecasting and inventory analytics combine sales history, seasonality, supply chain inputs, and ERP context to produce forecasts and purchasing plans. This is one of the clearest examples of manufacturing analytics extending beyond the shop floor into planning and business coordination.
Energy and sustainability analytics combine energy meters, emissions, and production data to create anomaly alerts, benchmarking views, and ESG or compliance outputs. ISO 50001 provides the framework for systematic energy management, which is why energy analytics should be treated as both an operational and compliance use case.
Workforce and safety analytics combine shift logs, incidents, and productivity data to identify patterns in performance, risk, and staffing. These use cases are often mostly descriptive and diagnostic, but can become predictive when incident risk or staffing pressure is modeled over time.
Supply chain analytics use supplier, transport, lead-time, and ERP data to score suppliers and anticipate delays. Cost and margin analytics combine material costs, capacity cost, scrap cost, and actual-vs-plan variance analysis to show how operational behavior affects unit economics. Microsoft’s Business Central manufacturing analytics materials are especially strong on work-center load, production time, scrap, and KPI views that support this kind of operating analysis.
Manufacturing analytics vs. business intelligence vs. manufacturing data platform
Manufacturing analytics is not the same thing as general business intelligence. BI usually focuses on reporting, visualization, and aggregation. Manufacturing analytics includes BI, but also adds operational modeling, root cause analysis, predictive models, prescriptive logic, and industrial data context. That is why the boundary between BI and analytics should be described as overlap, not replacement.
Manufacturing analytics also sits above the manufacturing data platform rather than replacing it. The platform organizes and governs industrial data. The analytics layer uses that data to produce KPIs, explanations, forecasts, and recommendations. In Smart RDM terms, the data and integration layer, central repository, and governance capabilities provide the foundation; the analytics, dashboards, event flows, and AI-assisted decision functions sit above that foundation.
Manufacturing analytics software, tools, and vendor landscape in 2026
The manufacturing analytics market includes both embedded enterprise products and specialized industrial analytics companies. Oracle positions Manufacturing Analytics within SCM Cloud and Fusion SCM Analytics, with connected insights across manufacturing, procurement, inventory, financials, and sales. NetSuite publishes manufacturing analytics guides and use cases focused on connecting pipelines and improving decisions. Microsoft Dynamics 365 Business Central positions manufacturing analytics around Power BI reports for utilization, capacity, work-center load, production time, and scrap.
MachineMetrics positions manufacturing analytics around machine data collection, equipment utilization, predictive use cases, and production process improvement. Altair frames manufacturing analytics solutions around real-time insight and predictive maintenance. Tredence and Kanerika publish educational overviews that position manufacturing analytics as the transformation of industrial data into actionable insight. Evocon focuses strongly on OEE, machine monitoring, production monitoring, and manufacturing analytics examples.
Smart RDM belongs in this landscape as an industrial data and AI platform that supports manufacturing analytics across OT/IT integration, governed data preparation, dashboards, reporting, predictive analytics, energy analytics, and AI-powered knowledge workflows. That is a broader position than a single manufacturing analytics dashboard, but still directly relevant to teams looking for manufacturing analytics software and a manufacturing analytics platform rather than just a BI add-on.
How to choose manufacturing analytics software
The first criterion is data access. A useful platform must handle MES, SCADA, ERP, historian, IIoT, CMMS, and external context without turning integration into a custom project every time. The second criterion is KPI and model maturity: it should support OEE, throughput, scrap, downtime, MTBF, MTTR, cost variance, and role-specific views from the start. The third is operational fit: can it serve operators, plant managers, maintenance, quality, analysts, and executive roles from the same governed data base?
The fourth criterion is architecture. Teams should evaluate whether the software supports real-time, batch, and edge processing, and whether it fits on-prem, cloud, hybrid, or embedded deployment patterns. The fifth is governance and OT/IT security. The sixth is the ability to move from pilot to multi-site scale. The seventh is practical usability: not only whether the tool can compute something, but whether it can put the result into the decision flow where operators, managers, or maintenance teams can act on it.
Implementation patterns: pilot, scale, multi-site
Most manufacturing analytics programs work best in phases. The first phase is a pilot with one use case, one line, or one plant. The second phase expands the source model, KPI coverage, and role adoption. The third phase scales the operating model to more sites, more personas, and more advanced use cases. Netsuite’s best-practice guidance on inventorying sources, connecting pipelines, and cleansing data reflects the same logic, and Smart RDM’s own positioning around scalable industrial data flows aligns with it.
The most common implementation mistake is trying to start with too much breadth and too little data discipline. NIST repeatedly emphasizes that high-quality, real-world data streams are essential for industrial AI and analytics, while Smart RDM’s own recent writing points to weak goals, poor accountability, and missing workflows as common reasons why analytics and AI pilots fail after the first phase.
Governance, security, and OT/IT risk
Manufacturing analytics should be treated as an OT/IT program, not just a reporting initiative. That means data quality, validation, lineage, and access control need to be built into the architecture. DAMA explicitly includes governance, quality, and security among core data-management functions, and industrial analytics simply makes that more operationally visible.
On the security side, IEC 62443 matters because it defines requirements and processes for secure industrial automation and control systems. In practice, OT/IT segmentation, controlled access, and safe data-sharing patterns are part of what makes manufacturing analytics deployable in real plants. Smart RDM’s own platform pages explicitly frame auditability, access management, and industrial security as platform capabilities rather than optional extras.
FAQ
What is manufacturing analytics?
Manufacturing analytics is the use of industrial data analysis to improve production, quality, maintenance, supply chain, and decision-making using descriptive, diagnostic, predictive, and prescriptive methods.
What are the 4 types of analytics?
The 4 types are descriptive, diagnostic, predictive, and prescriptive analytics. In manufacturing, they answer four questions in sequence: what happened, why it happened, what is likely to happen, and what should be done.
What is the difference between manufacturing analytics and business intelligence?
Business intelligence focuses mainly on reporting and visualization, while manufacturing analytics includes BI plus root cause analysis, predictive models, optimization, and industrial context from MES, SCADA, ERP, historians, and IIoT data.
What is industrial analytics?
Industrial analytics is a broader term that includes manufacturing analytics but may also cover utilities, energy, asset-heavy operations, and infrastructure. Manufacturing analytics is therefore a major subset of industrial analytics rather than a separate category.
What is OEE and how is it calculated?
OEE stands for Overall Equipment Effectiveness and is calculated as Availability × Performance × Quality. It is one of the most common aggregated manufacturing KPIs and is widely used alongside SEMI equipment-state and utilization metrics.
What is descriptive analytics in manufacturing?
Descriptive analytics summarizes what happened using aggregation, reports, dashboards, and historical trends. Typical outputs include KPI views, trend lines, and shift, line, or site summaries.
What is predictive analytics in manufacturing?
Predictive analytics uses techniques such as regression, classification, time-series forecasting, and anomaly detection to estimate future events or risks such as failures, demand changes, or quality issues.
What is prescriptive analytics in manufacturing?
Prescriptive analytics recommends actions using rules, optimization, simulation, or more advanced decision logic. In manufacturing, it often appears in scheduling, process optimization, maintenance actions, and scenario-based decision support.
What data sources feed manufacturing analytics?
Typical sources are IIoT sensors, MES, SCADA, ERP, historians, CMMS, operator input, vision systems, and external context such as weather or supplier signals.
How does manufacturing analytics work?
It typically follows a pipeline of ingestion, storage and modeling, analytics, and consumption. Data is collected from industrial and business systems, structured and validated, analyzed, and then delivered through dashboards, alerts, reports, or applications.
What is real-time manufacturing analytics?
Real-time manufacturing analytics uses streaming or near-real-time data to support live visibility, rapid anomaly detection, and faster operational decisions on the line or in the plant.
How does ISA-95 relate to manufacturing analytics?
ISA-95 provides the enterprise-to-control hierarchy and context that help organize data from Level 2, Level 3, and Level 4 systems such as SCADA, MES, and ERP. That structure makes analytics more consistent across roles and sites.
How does manufacturing analytics use IIoT data?
It uses IIoT data such as temperature, vibration, pressure, current, or flow as raw input for monitoring, anomaly detection, predictive models, and KPI calculations, usually through protocols such as OPC UA, MQTT, or Modbus.
What is the role of a data warehouse or lakehouse in manufacturing analytics?
The storage layer holds raw and curated data so analytics tools, dashboards, and ML models can work from a consistent base. It is a component of the architecture, not the full analytics program by itself.
How does manufacturing analytics handle batch vs continuous processes?
It uses different time, recipe, and process models depending on whether operations are batch or continuous. ISA-88 is especially relevant for batch control and for aligning batch process structures with ISA-95-style enterprise integration.
What are the use cases of manufacturing analytics?
The main use cases are predictive maintenance, quality and defect analysis, process optimization, demand forecasting, energy and sustainability analytics, workforce and safety analytics, supply chain analytics, and cost or margin analytics.
How does manufacturing analytics enable predictive maintenance?
It combines telemetry, historian data, and maintenance context to estimate anomalies, failure risk, or remaining useful life, then turns that into alerts and maintenance actions, often linked to CMMS work orders.
How does manufacturing analytics improve quality control?
It brings together process data, SPC logic, inspection results, and computer vision so teams can classify defects, detect root causes, and reduce preventable quality escapes.
How does manufacturing analytics improve OEE?
It improves OEE by measuring Availability, Performance, and Quality consistently, surfacing root causes of loss, and supporting faster action on downtime, speed loss, and defects.
How does manufacturing analytics support energy management?
It combines energy meters, production context, and anomaly logic to benchmark consumption, detect abnormal usage, and support ISO 50001-style energy management.
How does manufacturing analytics support supply chain decisions?
It connects ERP, supplier, inventory, and operational data to support demand forecasting, supplier scoring, and delay prediction.
How does manufacturing analytics support workforce planning?
It uses shift-level KPI mapping, productivity trends, and incident or workload context to help plants understand staffing patterns, performance differences, and operational risk by shift.
How to choose manufacturing analytics software?
Choose software based on source-system connectivity, KPI coverage, role fit, architecture, governance, and the ability to move from pilot to plant-wide or multi-site rollout.
What are the best manufacturing analytics tools in 2026?
The market includes Oracle, NetSuite, Microsoft Dynamics 365 Business Central, MachineMetrics, Altair, Evocon, Tredence, Kanerika, and Smart RDM, among others. The right fit depends on whether the buyer needs embedded ERP analytics, machine-level visibility, broader industrial analytics, or a governed OT/IT analytics platform.
What is the difference between a manufacturing analytics platform and embedded ERP analytics?
Embedded ERP analytics starts from ERP data and ERP workflows. A manufacturing analytics platform is broader because it also integrates SCADA, MES, historian, IIoT, CMMS, and operational context across OT and IT.
How much does manufacturing analytics cost?
Cost depends on the deployment model, data scope, integration effort, and licensing pattern. In practice, buyers should expect cost to come from both software and the work needed to connect, govern, and operationalize data.
How long does it take to implement manufacturing analytics?
Implementation is usually phased. Teams often start with one pilot use case and one plant or line, then expand the source model and role coverage once data quality and KPI logic are stable.
What skills are needed to run manufacturing analytics?
The core roles are usually data analyst, data engineer, OT engineer, and domain experts from production, quality, or maintenance. The key skill is linking industrial context to analysis, not just building dashboards.
What does a manufacturing analyst do?
A manufacturing analyst turns production, quality, maintenance, and supply chain data into actionable insight. That usually means monitoring KPIs, investigating root causes, supporting decisions, and translating findings into operational improvements.
What KPIs should manufacturing analytics track?
At minimum it should track OEE, throughput, cycle time, takt time, scrap rate, first pass yield, defect rate, downtime, MTBF, MTTR, schedule adherence, cost per unit, energy per unit, work-center load, WIP, and inventory turns.
How is data quality managed in manufacturing analytics?
Through validation, standardization, context modeling, and lineage. This is one reason governed industrial platforms such as Smart RDM emphasize auditable repositories and controlled data flows instead of raw exports and spreadsheets.
How is OT/IT security managed for manufacturing analytics?
By treating analytics as part of the OT/IT architecture and applying practices such as segmentation, controlled access, and industrial cybersecurity standards such as IEC 62443.
What outcomes do industry case studies report?
Industry case studies commonly report improvements in uptime, throughput, quality, and scrap reduction when analytics is connected to operations rather than treated as reporting only. McKinsey and NIST both frame analytics and AI as productivity and profitability enablers when they are grounded in real industrial data and decision flows.
What are common pitfalls of manufacturing analytics projects?
The most common pitfalls are weak data quality, disconnected data pipelines, unclear ownership, dashboards with no action path, and pilots that never connect to real operational workflows.
What are the 7 sectors of manufacturing?
There is no single universal seven-part split, but a practical grouping includes process manufacturing, discrete manufacturing, food and beverage, chemicals, pharmaceuticals, metals and heavy industry, and utilities- or infrastructure-adjacent industrial operations. Different sectors create different analytics priorities, but the data-to-decision logic is similar across them.
Final takeaway
Manufacturing analytics is the layer that turns industrial data into decisions. It uses descriptive, diagnostic, predictive, and prescriptive methods to move from raw signals and work orders to KPIs, alerts, recommendations, and action paths across production, quality, maintenance, energy, workforce, supply chain, and cost.
Smart RDM fits this space when it is positioned clearly: not just as a dashboard or AI add-on, but as an industrial data and AI platform that supports the full chain from ingestion and governance to analytics, reporting, knowledge, and decision support. That is what makes manufacturing analytics usable at scale rather than just visible on a slide.
Light mode