
Process optimization: methods & tools

Gabriela Gic-Grusza

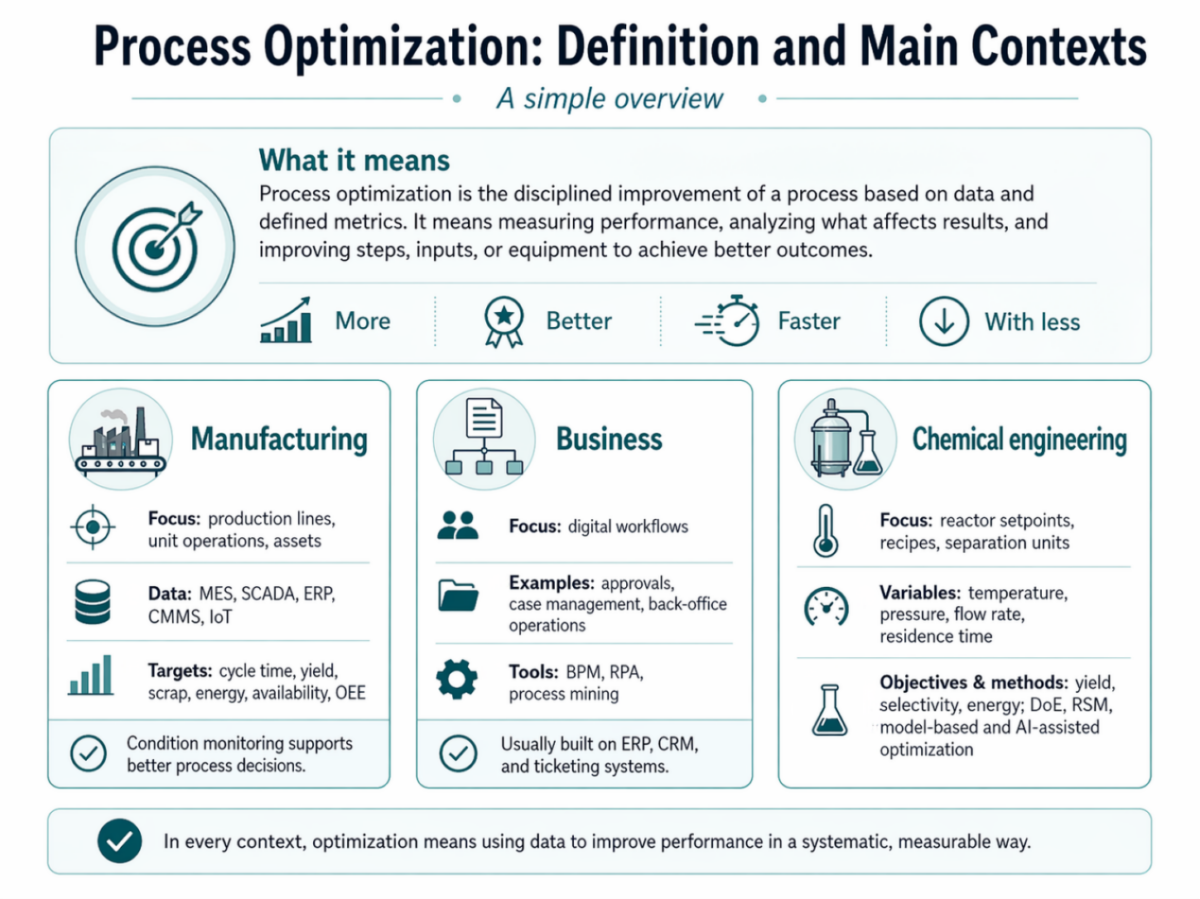
Process optimization is the structured practice of improving how work gets done so organizations can reduce waste, improve quality, and achieve better business outcomes. In practice, it combines methods such as Six Sigma, Lean, Kaizen, TQM, BPR, and PDCA with tools such as process mining, process mapping, BPM suites, RPA, SPC, and AI/ML to improve measurable outcomes like cycle time, defect rate, throughput, and cost. It applies to office workflows, manufacturing lines and chemical processes alike.
What process optimization means in practice
Process optimization means analyzing a process, identifying where performance is lost, and changing the process in a controlled way so it performs better against defined goals. In business settings, that usually means faster workflows, fewer errors, lower operating cost, or better customer experience. In industrial settings, it also means better process stability, higher yield, better setpoints, lower losses, and more predictable operations.
That is why the term has more than one domain. Business process optimization usually refers to workflows in finance, service, HR, procurement, or administration. Manufacturing process optimization applies the same logic to production lines, equipment behavior, recipes, setpoints, and plant coordination. In chemical engineering, the same idea often appears in reactor tuning, yield improvement, process conditions, and trade-offs between quality, energy, and stability.
The simplest process optimization definition is this: it is a systematic way of improving a process so it becomes more efficient, effective, and controllable. The important word is systematic. Optimization is not random trial and error. It is usually based on measurement, analysis, redesign, implementation, and control.
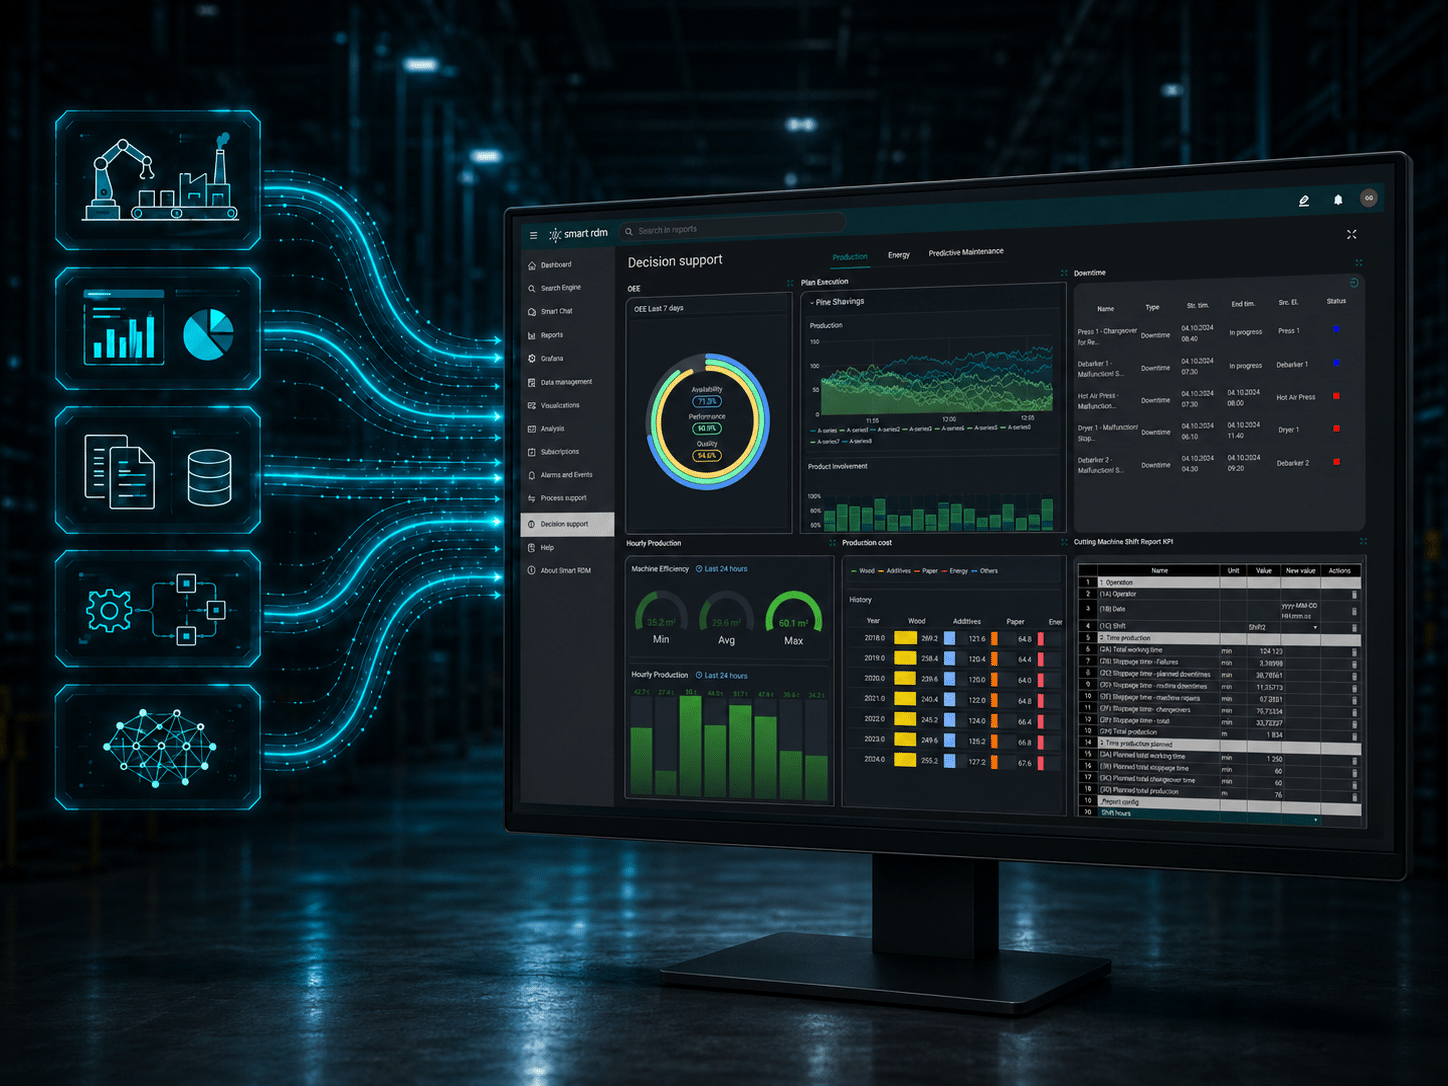
For Smart RDM, process optimization matters because it is the point where industrial data turns into action. Smart RDM positions itself as an industrial data and AI platform that connects OT and IT, standardizes data, and supports analytics, reporting, dashboards, AI/ML models, and operational decision flows in one environment.
Process optimization vs. process improvement
Process optimization and process improvement are related, but they are not the same thing. Process improvement is the broader concept: continuously making processes better over time. Process optimization is narrower and more quantitative: it focuses on achieving better process performance against defined objectives, constraints, and metrics.
In practice, improvement can be cultural and ongoing, while optimization is often more method-driven and target-driven. A team may improve a process by clarifying roles, simplifying approvals, or documenting work better. It optimizes a process when it deliberately uses data, methods, and tools to reduce cycle time, cut cost per unit, lower defect rate, or increase throughput.
This distinction matters on a website because many readers search for process optimization meaning when they actually want a practical answer: not “how do we work better in general,” but “how do we improve measurable performance in a disciplined way?” That is exactly where optimization sits.
| Dimension | Process improvement | Process optimization |
| Scope | Broad, continuous, cultural | Focused, structured, project-like |
| Target | “Better than before” | Measurable optimum against a KPI |
| Methods | Kaizen, suggestion systems, continuous improvement | DMAIC, DoE, mathematical optimization, AI/ML |
| Data requirement | Helpful | Mandatory |
| Typical duration | Ongoing, unbounded | Defined project cycle |
| Owner | Everyone | Process engineer, black belt, data scientist |
The main methods used in process optimization
There is no single best method for every situation. Different methods are designed for different types of problems: variation, waste, quality, flow, redesign, or control. The most widely used process optimization methods are Six Sigma, Lean, Kaizen, TQM, BPR, and PDCA/PDSA.
Six Sigma
Six Sigma is a structured framework for reducing variation and defects. ASQ describes it as a fact-based, data-driven philosophy of quality improvement, and its most recognized target is 3.4 defects per million opportunities, often expressed as 99.99966% defect-free performance. The best-known Six Sigma roadmap is DMAIC: Define, Measure, Analyze, Improve, Control. For design-oriented work, Six Sigma also uses DMADV: Define, Measure, Analyze, Design, Verify.
Historically, Six Sigma originated at Motorola in the 1980s and was later widely popularized at GE under Jack Welch. That history matters because it explains why Six Sigma is still strongly associated with statistical discipline, measurable business results, and tools such as control charts, hypothesis testing, and capability analysis.
Six Sigma is especially useful when the process problem is variation, unstable performance, or quality loss. It gives optimization work a formal structure and a control phase, which is why it remains one of the most durable frameworks for process optimization.
Lean
Lean is the waste-elimination side of process optimization. Lean Enterprise Institute describes value stream mapping as diagraming every step in the material and information flows needed to bring a product from order to delivery, and places that practice inside the broader Toyota Production System tradition. Lean focuses on flow, waste reduction, and creating more value with fewer resources.
In day-to-day practice, Lean often starts with the eight wastes commonly remembered as TIMWOODS: Transport, Inventory, Motion, Waiting, Overproduction, Overprocessing, Defects, and Skills. It also uses tools such as value stream mapping, 5S (Sort, Set in order, Shine, Standardize, Sustain), pull systems, and just-in-time logic. Lean is strongest when the process suffers from delay, handoff waste, rework, excess motion, or poor flow.
Lean and Six Sigma are complementary rather than competing. Lean focuses on waste and flow; Six Sigma focuses more on variation and control. That is why Lean Six Sigma remains one of the most common combined approaches in real programs.
Kaizen
Kaizen is the philosophy of continuous improvement through small, incremental changes. ASQ training materials explicitly tie Kaizen to Lean and to the use of PDCA inside day-to-day improvement. Kaizen is less about one large redesign and more about repeated, practical changes driven by teams close to the work.
A key concept here is gemba. Lean Enterprise Institute defines a gemba walk as a management practice for understanding the current situation through direct observation and inquiry before taking action. In other words, optimization should start where value is actually created, not only in presentations and workshop rooms.
TQM
Total Quality Management (TQM) is a broader management approach aimed at long-term success through customer satisfaction. ASQ describes TQM as a quality-centered management approach that emphasizes customer focus, total employee involvement, process-centered thinking, integrated systems, and fact-based decision making.
TQM matters in this article because it gives process optimization a wider organizational context. Six Sigma can sit inside a TQM-style environment; so can Kaizen, SPC, and structured continuous improvement. TQM is therefore not a replacement for those methods, but a broader quality-management frame around them.
BPR
Business Process Reengineering (BPR) is the radical end of the spectrum. IBM defines it as the radical redesign of business processes to achieve dramatic improvements in performance and effectiveness. It is closely associated with Hammer and Champy’s 1993 work on fundamental rethinking and clean-slate redesign.
That makes BPR very different from Kaizen or PDCA. Kaizen is incremental. BPR is radical. If the process is structurally broken, incremental tuning may not be enough. But because BPR is more disruptive, it is better treated as an extreme variant of process optimization, not the default answer to every inefficiency.
PDCA / PDSA
PDCA and PDSA are iterative improvement cycles. ASQ describes PDCA as a four-step model for carrying out change, while the Deming Institute describes PDSA as a systematic process for gaining knowledge for continual improvement. ISO 9001 materials also explicitly connect the PDCA cycle to process and system management.
That is why PDCA/PDSA appears everywhere: it is both a standalone management method and the operating loop inside Kaizen, Lean, and quality systems. It is also one of the clearest answers to the question “what are the steps in process optimization?” because it turns improvement into a repeatable cycle rather than a one-time project.
Lean Six Sigma
Lean Six Sigma is the combined method: Lean removes waste and speeds up flow; Six Sigma reduces variation and defects. The two use complementary tools (value stream mapping plus SPC, 5S plus DMAIC) and a shared belt hierarchy (Yellow, Green, Black, Master Black). Most large industrial organizations today practice Lean Six Sigma rather than either method on its own.
Comparison of methods
| Method | Primary focus | Pace | Signature tool |
| Six Sigma | Variation & defects | Project | DMAIC, SPC |
| Lean | Waste & flow | Continuous + events | Value stream mapping, 5S |
| Kaizen | Culture | Continuous | Gemba walk, PDCA |
| TQM | Quality culture | Continuous | Policy deployment |
| BPR | Radical redesign | One-off | Clean-slate process design |
| PDCA / PDSA | Iterative learning | Continuous | 4-step cycle |
A practical step-by-step implementation cycle
In real organizations, process optimization usually follows a recognizable pattern even if teams do not always label it formally. The most common structure is close to DMAIC: identify → measure → analyze → improve → control. That sequence is also consistent with many BPM and consulting playbooks: map the process, define the objective, measure the baseline, locate bottlenecks, redesign the future state, implement changes, and monitor results.
A practical version looks like this:
- Identify the process and objective. Scope the boundaries, the inputs, the outputs, the customer and the KPI that defines success. Tools: SIPOC (Supplier-Input-Process-Output-Customer) diagrams, project charters
- Map the current state using a flowchart, BPMN, SIPOC, swimlane diagram, or value stream map.
- Measure baseline performance. Collect baseline data — cycle time, defect rate, throughput, cost — from MES, ERP, event logs or manual time studies. The process must be measurable before it can be optimized.
- Analyze bottlenecks and causes. Find where the process fails, waits or produces defects. Techniques include root cause analysis, Pareto analysis, fishbone (Ishikawa) diagrams and process mining’s conformance checking..
- Improve the process. Design and test changes — new sequence, new setpoints, automation, training, equipment. Pilot on a small scope first, then scale.
- Control the new state. Lock in the improvement with standard work, control plans, SPC charts and dashboards. Without control, processes drift back.
- (Optional) Review. Feed results into the next PDCA cycle. Continuous improvement is a loop, not a line.
That same logic works in office workflows, manufacturing, and chemical operations. What changes is the type of data, the type of constraints, and the software used to support the cycle.
The tools most often used in process optimization
Methods tell you how to think about the problem. Tools help you execute. In practice, the most common process optimization tools are process mining, process mapping, BPM suites, RPA, AI/ML, and SPC.
Process mining
Process mining is a diagnostic tool built on event log analysis. Celonis describes conformance checking as the automatic comparison of a reference process model with the actual process flows discovered from data. In practical terms, process mining helps teams discover how the process really runs, not just how it was documented.
That makes process mining especially valuable at the beginning of optimization work. It discovers the actual process map, identifies deviations, and helps surface bottlenecks automatically. It is therefore a diagnostic tool for process optimization, not the optimization method itself.
Process mapping
Process mapping is the visualization layer of process optimization. OMG defines BPMN as a graphical notation for specifying business processes in a Business Process Diagram, while Lean Enterprise Institute defines value stream mapping as the diagraming of material and information flow from order to delivery. SIPOC is another useful mapping frame: Suppliers, Inputs, Process, Outputs, Customers.
This matters because process maps reveal the current state, future-state options, swimlane responsibilities, and handoff friction. Good optimization almost always starts with making the process visible.
BPM suites
BPM suites provide the orchestration layer for modeling, running, and monitoring workflows. ProcessMaker positions itself as workflow and business process automation software for designing, running, reporting, and improving processes. Bizagi positions itself as a low-code process orchestration platform that automates processes while coordinating people, systems, bots, and data. Nintex similarly focuses on workflow automation and process management.
These platforms matter when optimization needs not only analysis, but also execution logic, governance, and workflow monitoring. They are especially relevant in business process optimization, though the same orchestration concepts increasingly touch industrial operations as well.
RPA
Robotic Process Automation is the automation layer for repetitive, rule-based tasks. Automation Anywhere defines RPA as software that automates repetitive digital tasks with bots. UiPath distinguishes clearly between attended automations, which run under human supervision, and unattended automations, which operate independently based on triggers or task events. Blue Prism positions itself in the same RPA and intelligent-automation category.
RPA belongs in process optimization because once a process is simplified and standardized, software bots can execute repetitive steps consistently and at scale. When RPA is combined with AI/ML, it becomes part of intelligent automation rather than simple task repetition.
AI/ML for process optimization
AI and machine learning are advanced enablers of process optimization. IBM explicitly includes automation and AI in its definition of process optimization. In practice, AI is most useful in three places: predictive analysis, prescriptive recommendation, and more adaptive process design or support using generative AI.
That means AI process optimization is not one thing. It can include forecasting delays or failures, recommending better process parameters, detecting process deviation, or helping teams design documentation and workflows faster. Smart RDM’s own AI process optimization page explicitly lists predictive models, prescriptive models, anomaly detection, RUL, trend analysis, process deviation prediction, and automatic operational recommendations.
Digital twin can also support process optimization by enabling virtual testing and safer experimentation, but it deserves its own dedicated article. Here it is enough to say that it is one of the advanced tools that can support optimization, especially when paired with industrial data and simulation models. For a full treatment, see our separate guide to Digital Twin in Manufacturing.
SPC
Statistical Process Control is the quality-monitoring layer inside many optimization programs. ASQ defines a control chart as a graph used to study how a process changes over time, with a center line plus upper and lower control limits. NIST explains process capability through capability indices, including Cp and Cpk. Shewhart’s work is the historical foundation for SPC, and many practitioners also apply Western Electric rules to detect non-random patterns on control charts.
In practical terms, SPC uses chart types such as X-bar, R, p, and c charts to track process stability, plus rules and capability indices to show whether the process is predictable and capable. SPC is therefore not separate from process optimization; it is one of the ways optimized processes stay under control.
Other tools worth knowing
- Taguchi method — a DoE technique for robust design using orthogonal arrays.
- Simulation — discrete-event or agent-based modeling for throughput and capacity analysis.
- Decision support systems — software that combines data, models and visualization to help operators choose the best action under uncertainty.
How process optimization applies in manufacturing
Manufacturing process optimization is the industrial application of the same discipline. It focuses on improving how a production process actually runs: line behavior, setpoints, recipes, yield, quality, and coordination across assets and systems. Smart RDM’s manufacturing page describes this as turning raw operational data into measurable improvements in how production systems work across machines, lines, and whole plants.
To stay within cluster scope, this article keeps adjacent manufacturing topics brief. Production optimization, OEE, predictive maintenance, energy optimization, scenario simulation, and what-if analysis all deserve their own separate guides. Here, they matter as linked outcomes or neighboring disciplines, not as main topics. Process optimization in manufacturing is the umbrella practice of improving the process itself; those related topics sit beside it or downstream of it.
This is also where ISA standards become useful. ISA-95 provides the integration frame between enterprise and manufacturing control systems, while ISA-88 provides structure for batch process control, including recipes and procedural models. That makes them relevant when process optimization depends on MES, SCADA, ERP, historian data, batch logic, or recipe-centered operations.
The KPIs that show whether optimization is working
Process optimization should always be measured. The most common metrics are cycle time, lead time, throughput, capacity utilization, cost per unit, cost reduction percentage, defect rate, error rate, scrap rate, first-pass yield, customer satisfaction, ROI, and time-to-value. In manufacturing, OEE is also a common reference metric, though its full formula belongs in a separate dedicated article.
The key principle is simple: every optimization initiative should define the baseline, target, time horizon, owner, and control logic. Without that, teams may improve activity without proving business value.
| KPI | What it measures | Where it fits |
| Cycle time / lead time | End-to-end duration of the process | Speed |
| Throughput / capacity utilization | Output per unit time; share of capacity used | Speed / volume |
| Cost per unit / cost reduction % | Unit economics; savings vs. baseline | Cost |
| Defect rate / error rate / scrap rate | Quality failures as % of output | Quality |
| First pass yield (FPY) | Share of units produced correctly the first time | Quality |
| Customer satisfaction (NPS, CSAT) | Downstream quality signal | Quality / outcome |
| OEE | Composite manufacturing metric (see dedicated OEE guide) | Manufacturing composite |
| Cp / Cpk | Process capability against spec limits | Statistical control |
| ROI of optimization initiative | Savings vs. cost of the project | Financial |
| Time-to-value | How long before benefits are realized | Financial / delivery |
Process optimization examples
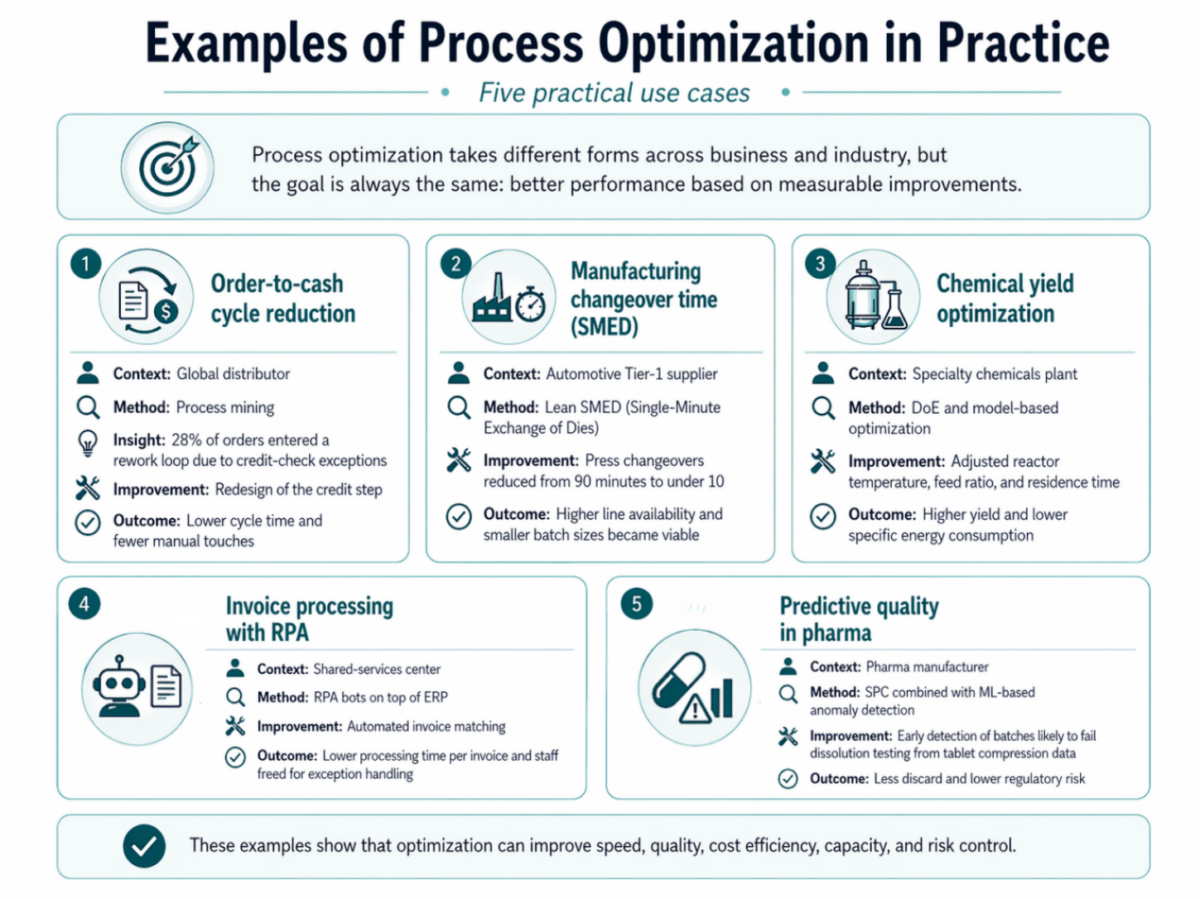
A business example might be an invoice-approval workflow. Process mapping shows duplicate approvals, process mining identifies where queues build up, BPM orchestration standardizes the future-state flow, and RPA automates repetitive handoffs. The result is lower lead time, fewer exceptions, and better visibility.
A manufacturing example might be recipe or setpoint tuning on a production line. Teams combine historian data, SCADA context, and structured analysis to reduce variability, improve quality, and stabilize output. Smart RDM explicitly frames manufacturing optimization in this data-to-decision way, using operational context, analytics, and AI support rather than isolated reporting.
A chemical-engineering example might be optimizing a nonlinear process with competing objectives such as yield, energy, and stability. NIST and AIChE materials on design and optimization show why experimental design, process data, and constrained decision-making matter in those contexts. The Taguchi method is one example of an experimental-design approach still associated with process optimization studies.
Process optimization software and vendor landscape 2026
The current landscape spans broad enterprise platforms, BPM suites, industrial specialists, and enabling-tool vendors. IBM frames process optimization broadly around structured methods, automation, and AI. ProcessMaker and Nintex are workflow- and BPM-oriented. BOC Group focuses on BPM and process analysis. OTRS emphasizes process optimization in service-heavy workflows. Globant connects optimization to digital transformation and AI. Celonis is strongly associated with process mining, while UiPath and Blue Prism are strongly associated with RPA and intelligent automation. Precognize stands out for a manufacturing-specific angle.
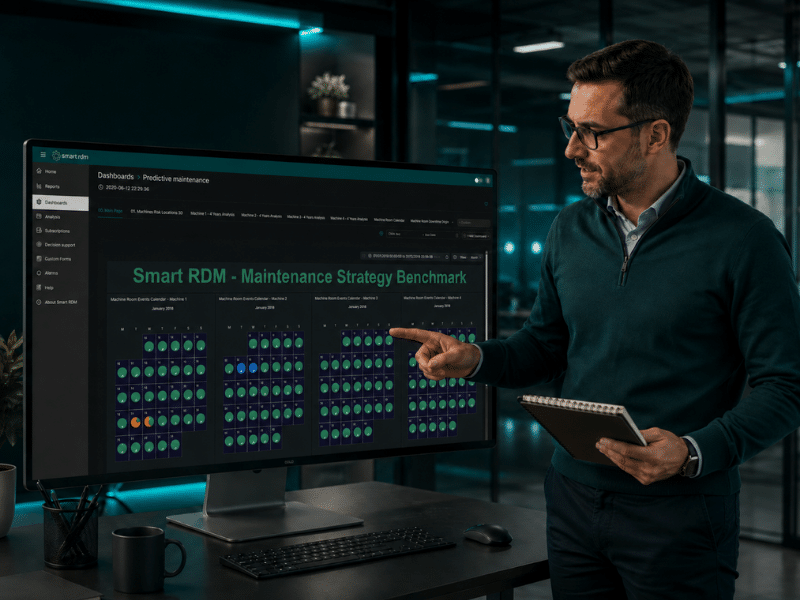
Smart RDM belongs in this landscape from the industrial side. It is not a generic BPM suite. It is an industrial data and AI platform that supports process optimization through OT/IT integration, governed data preparation, analytics, dashboards, AI/ML models, and role-based decision support. That is the key reason it fits manufacturing and industrial process optimization especially well.
| Vendor | Positioning (1-liner) |
| IBM | Enterprise technology vendor publishing extensive process optimization content and offering automation and AI platforms (IBM Cloud Pak for Business Automation, watsonx). |
| 6Sigma.us | Training and consulting provider focused on Lean Six Sigma certification and deployment. |
| ProcessMaker | BPM / workflow automation platform with AI-assisted design, marketed to mid-market and enterprise business operations teams. |
| Precognize (Precog) | Industrial analytics and process anomaly detection vendor targeting process-manufacturing operations. |
| Nintex | Process management and workflow automation platform (Nintex Process Platform, Nintex Automation) for BPM and RPA use cases. |
| OTRS | Service management and workflow software provider emphasizing continuous improvement in IT and customer-service processes. |
| BOC Group | Enterprise architecture and BPM software vendor (ADONIS) focused on process modeling and governance. |
| EO Johnson | North American managed-services provider offering process optimization as part of document and business-process outsourcing. |
| Globant | Digital and IT services consultancy publishing thought leadership on process optimization and offering delivery services. |
| Celonis | Process mining platform leader providing process discovery, conformance checking and execution management. |
| UiPath | RPA and intelligent-automation platform vendor with native process mining and AI capabilities. |
| Smart RDM | Industrial data and AI platform integrating MES/SCADA/ERP/IoT sources for manufacturing process optimization use cases. |
How to choose tools and implement them
Choose methods first, then tools. If the main problem is variation and defects, Six Sigma and SPC may be the right starting point. If the main problem is waste and flow, Lean and value stream mapping are often better. If the process is poorly understood, process mining and mapping come first. If the process is repetitive and rules-based, BPM and RPA matter more. If the process is data-rich and dynamic, AI/ML can add value after visibility and measurement are already in place.
Implementation also depends on roles. A process optimization engineer usually maps, measures, analyzes, redesigns, and controls processes using methods such as Lean, Six Sigma, SPC, process mining, and automation. A data analyst supports measurement and pattern discovery. A plant manager focuses on flow, stability, and coordination. A quality manager focuses on variation and control. At executive level, the concern shifts toward cost, risk, governance, ROI, and time-to-value.
A phased implementation approach
A typical implementation follows four phases: diagnose (measure the current state, identify the highest-leverage processes), design (select methods and tools, redesign the target state), deliver (pilot, iterate, scale), and operate (control plans, dashboards, continuous improvement cadence). Each phase should end with a measurable gate — you do not design before diagnosis is complete, and you do not scale before the pilot has proven the KPI case.
FAQ
What is meant by process optimization?
Process optimization means systematically improving a process so it performs better against measurable goals such as speed, quality, cost, or stability. It uses structured methods and tools rather than informal trial and error.
Is process optimization a hard skill?
Yes. It is increasingly treated as a hard skill because it requires process mapping, KPI design, data analysis, method selection, and often tool proficiency in areas such as BPM, SPC, mining, automation, or industrial analytics.
What are the 4 types of process strategies?
There is no single universal four-part standard, but in practice organizations often choose among four strategic patterns: incremental improvement, waste elimination, variation reduction, and radical redesign. Those patterns map broadly to PDCA/Kaizen, Lean, Six Sigma, and BPR.
What is the difference between process improvement and process optimization?
Process improvement is the broader idea of making processes better over time. Process optimization is the more structured, metric-driven discipline of improving process performance against defined targets.
What is DMAIC?
DMAIC stands for Define, Measure, Analyze, Improve, and Control. It is the most common Six Sigma framework for improving an existing process.
What is Lean in process optimization?
Lean is a waste-elimination approach rooted in the Toyota Production System. It focuses on value, flow, just-in-time logic, and identifying wastes that slow the process down or add cost without adding value.
What is Kaizen?
Kaizen is the philosophy of continuous improvement through small, incremental changes, usually driven by teams close to the work and supported by iterative cycles such as PDCA.
What is TQM?
TQM, or Total Quality Management, is a management approach aimed at long-term success through customer satisfaction, total employee involvement, and fact-based decision making across the organization.
What is BPR?
Business Process Reengineering is the radical redesign of core processes to achieve dramatic performance improvement. It is the opposite end of the spectrum from incremental continuous improvement.
What is PDCA / PDSA?
PDCA and PDSA are iterative improvement cycles: Plan-Do-Check/Study-Act. They are widely used as the operating loop inside continuous improvement and quality-management systems.
What is process mining?
Process mining is the use of event logs to discover how a process actually runs, compare it with a reference model through conformance checking, and identify bottlenecks or deviations automatically.
What is process mapping?
Process mapping is the visual representation of how a process works, typically using flowcharts, BPMN, swimlane diagrams, SIPOC, or value stream maps.
What is value stream mapping?
Value stream mapping is a Lean tool used to diagram every step in the material and information flows needed to deliver a product or service, making waste and future-state opportunities easier to see.
What tools are used for process optimization?
The main tool groups are process mining, process mapping, BPM suites, RPA, SPC, and AI/ML. Which one matters most depends on whether the main problem is visibility, flow, variation, repetitive work, or dynamic decision-making.
What is RPA in process optimization?
RPA is the use of software bots to automate repetitive, rule-based tasks. In optimization work, it usually implements standardized steps after the process has already been simplified and clarified.
How is AI used in process optimization?
AI is used to forecast risk, recommend actions, detect process deviation, support prescriptive optimization, and assist with documentation or workflow design. In industrial settings, it is most valuable when it sits on top of governed operational data.
What is SPC?
Statistical Process Control is a method for monitoring process stability using tools such as control charts, control limits, capability indices, and rule-based interpretation of process behavior.
How do you optimize manufacturing processes?
At a high level: define the target process, map the current state, measure performance, identify bottlenecks, improve the flow or parameters, and then control the result. For a full plant-focused discussion, see our separate guide to Production Optimization.
What KPIs measure process optimization?
Typical KPIs include cycle time, lead time, throughput, capacity utilization, cost per unit, cost reduction, defect rate, scrap rate, first-pass yield, customer satisfaction, ROI, and time-to-value. In manufacturing, OEE is also commonly used at a high level.
How does digital twin support process optimization?
Digital twin can support optimization by enabling safer virtual testing, parameter experimentation, and comparison of alternative operating choices before changing the live process. For a full explanation, see our separate guide to Digital Twin in Manufacturing.
How does process optimization relate to predictive maintenance?
Predictive maintenance is one specific application where optimization logic helps turn asset signals into better maintenance timing, prioritization, and action. For a deeper treatment, see our separate guide to Predictive Maintenance.
What are process optimization examples?
Common examples include invoice-approval workflows, order-to-cash bottleneck removal, recipe or setpoint tuning in manufacturing, and constrained operating optimization in chemical processes.
Is process optimization a hard skill or a role?
It is both. It is a hard skill set built on methods, metrics, and tools, and it also appears as a role in titles such as process optimization engineer, continuous improvement engineer, or process analyst.
What is a process optimization engineer?
A process optimization engineer is a practitioner who maps, measures, analyzes, redesigns, and controls processes using methods such as Lean, Six Sigma, SPC, process mining, automation, and data analysis to improve measurable outcomes.
What is the ROI of process optimization?
ROI comes from measurable gains such as lower cycle time, fewer defects, reduced operating cost, higher throughput, or faster time-to-value. The exact number varies by process and starting maturity, which is why a clear baseline and target are essential before implementation.
Final takeaway
Process optimization is best understood as a practical discipline for improving how work actually happens. The most effective programs combine structured methods, process visibility, measurement, and the right execution tools instead of relying on one fashionable concept alone.
For Smart RDM, that means process optimization is not a generic slogan. It is a concrete industrial use of connected OT/IT data, analytics, AI/ML, dashboards, and governed operational context to improve real processes in ways teams can measure and sustain.

Light mode