

Energy management system: complete guide (2026)

Marek Zając

An energy management system monitors, controls, and optimizes energy use across buildings, industrial plants, or infrastructure. A well-implemented EMS can support 10–30% energy cost reduction and provides the operational structure needed for ISO 50001 energy management.
Energy is no longer just a utility bill. In manufacturing, commercial buildings, data centers, and utilities, energy is now a controllable operating variable. The way a site uses electricity, gas, steam, compressed air, water, and heat affects cost, reliability, emissions, production planning, and regulatory reporting.
An energy management system, often abbreviated as EMS or EnMS, gives organizations a structured way to measure energy consumption, analyze where losses occur, control energy-intensive systems, and verify whether improvement actions are working. In practice, it combines meters, sensors, software, dashboards, analytics, control systems, and management processes.
For industrial companies, the most important shift is from monthly energy reporting to operational energy management. Instead of asking only “how much did we spend last month?”, an EMS helps answer more useful questions:
- Which line, asset, process, or building uses the most energy?
- When do peak loads occur?
- How much energy is consumed per unit of output?
- Which systems run when they should be idle?
- Are compressed air, steam, HVAC, or electrical systems operating efficiently?
- Which energy-saving actions actually reduced consumption?
- Can energy data support ISO 50001, ESG reporting, or carbon tracking?
This guide explains what an energy management system is, how it works, which types exist, how ISO 50001 fits, what EMS software should include, and how manufacturers can implement energy management without turning it into a disconnected reporting project.
What is an energy management system?
A smart energy management system is a combination of technology and processes used to monitor, analyze, control, and improve energy performance.
In a simple form, an EMS collects energy consumption data from meters and sensors, presents it in dashboards, and helps teams identify inefficient usage patterns. In a more advanced form, an energy management control system can automate control actions, support demand response, perform peak load management, correlate energy with production output, and provide data for compliance or sustainability reporting.
UNIDO describes an energy management system as a framework that helps industrial, commercial, and public sector organizations manage energy use and identify opportunities to adopt or improve energy-saving technologies. ISO describes ISO 50001 as a voluntary international standard that gives organizations a recognized framework for integrating energy performance into management practices and continually improving energy performance over time.
A practical EMS usually includes three dimensions:
| Dimension | What it includes | Purpose |
| Measurement | meters, sensors, smart meters, sub-metering, data acquisition | collect reliable energy data |
| Analysis | dashboards, reports, EnPIs, baselines, load profiles, alerts | understand consumption and performance |
| Action | controls, optimization rules, demand response, operating procedures | reduce waste and improve energy performance |
An EMS should not be treated only as energy management system software. Software matters, but the system also needs governance, targets, accountability, procedures, and review. Without that process layer, dashboards may show energy consumption but fail to change operational behavior.
How does an energy management system work?
An EMS works by collecting energy data, processing it into performance indicators and insights, and using those insights to drive control or optimization actions.
A useful architecture can be described in three layers:
data layer → processing layer → action layer
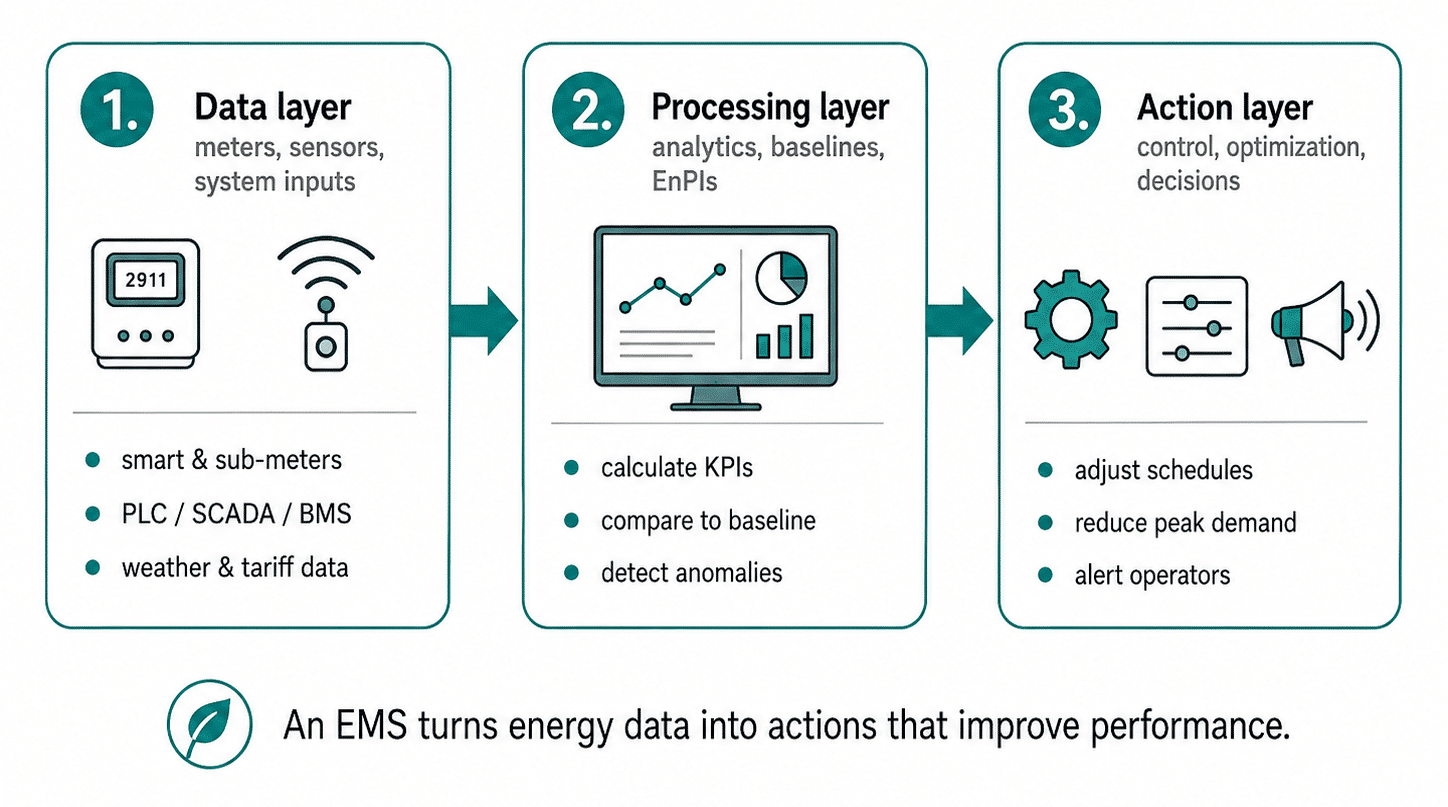
1. Data layer: meters, sensors, and system inputs
The data layer collects information from energy-consuming assets, utility feeds, and operational systems.
Typical data sources include:
- smart meters,
- sub-meters,
- electricity meters,
- gas meters,
- steam meters,
- compressed air meters,
- water meters,
- heat meters,
- IoT sensors,
- PLCs,
- SCADA systems,
- BMS/BEMS platforms,
- MES,
- ERP,
- production counters,
- weather data,
- tariff data.
For many sites, the first EMS implementation challenge is not analytics. It is metering coverage. If a plant has only one main electricity meter, it can see total consumption but cannot identify which line, compressor, oven, chiller, or building area is responsible for the load.
Sub-metering solves that problem by breaking total consumption into meaningful zones, processes, systems, or assets.
2. Processing layer: analytics, baselines, and EnPIs
The processing layer transforms raw measurements into useful information. It calculates energy performance indicators, compares current consumption against baselines, detects abnormal patterns, and prepares reports.
Examples include:
- kWh per unit produced,
- energy cost per batch,
- compressed air consumption per shift,
- peak demand by hour,
- power factor trends,
- load profile by line,
- standby consumption,
- energy intensity by product,
- comparison against energy baseline,
- cost per kWh saved.
The U.S. Department of Energy explains that ISO 50001 uses Energy Performance Indicators, or EnPIs, as quantitative measures of energy performance, and that energy baselines serve as references against which future energy performance changes are evaluated.
3. Action layer: control, optimization, and operating decisions
The action layer turns insight into action. This can be manual, semi-automated, or automated.
Examples include:
- adjusting HVAC schedules,
- shifting loads away from peak tariff periods,
- switching off idle equipment,
- correcting compressed air leaks,
- optimizing chiller operation,
- rescheduling energy-intensive production,
- triggering maintenance checks for inefficient assets,
- alerting operators to abnormal consumption,
- supporting demand response programs.
The action layer is what separates energy visibility from energy management. A dashboard may show a peak load. An EMS process should help prevent the next one.
Types of energy management systems
Energy management systems can be grouped into industrial, building, home, and grid-level systems.
The same core idea applies across all types: measure energy, analyze performance, and take action. The difference is the operating context.
| Type | Main environment | Typical users | Typical systems controlled | Main objective |
| IEMS — Industrial Energy Management System | factories, production sites, process plants | energy managers, production teams, maintenance, operations | machines, production lines, compressed air, steam, electrical systems, furnaces, chillers | reduce industrial energy intensity and cost |
| BEMS — Building Energy Management System | commercial buildings, campuses, hospitals, offices | facility managers, building operators | HVAC, lighting, ventilation, occupancy-based control, building services | optimize building comfort, cost, and energy use |
| HEMS — Home Energy Management System | residential buildings | homeowners, installers, energy service providers | solar PV, batteries, heat pumps, EV charging, smart appliances | optimize home generation, storage, tariffs, and consumption |
| Grid-level EMS | utilities, microgrids, distributed energy systems | utilities, aggregators, grid operators | storage, distributed generation, grid assets, flexible loads | balance supply, demand, reliability, and peak load |
Industrial Energy Management System
An Industrial Energy Management System, or IEMS, focuses on energy use in manufacturing and process environments. It monitors process-level consumption and connects energy data with production context.
Typical IEMS use cases include:
- compressed air monitoring,
- steam system monitoring,
- electrical load profiling,
- furnace or oven energy analysis,
- chiller and cooling system optimization,
- energy per unit output,
- production-energy correlation,
- load scheduling,
- line-level benchmarking.
For example, a manufacturer may discover that two lines produce the same product at different energy intensity levels. The difference may come from equipment condition, operating settings, idle time, changeover practices, or product mix. The EMS makes that difference visible.
Building Energy Management System
A Building Energy Management System, or BEMS, focuses on building systems such as HVAC, lighting, ventilation, occupancy-based control, and comfort conditions. It often overlaps with a Building Management System, or BMS.
Typical BEMS capabilities include:
- HVAC control,
- lighting control,
- occupancy-based optimization,
- time schedules,
- zone control,
- energy reporting,
- fault detection,
- BACnet or Modbus integration,
- Direct Digital Control, or DDC.
A BEMS is building-specific. An EMS is the broader category. In practice, a BEMS can be one part of a wider enterprise energy management strategy.
Home Energy Management System
A Home Energy Management System, or HEMS, is a consumer-facing EMS for residential environments. It typically coordinates smart home devices, solar panels, batteries, heat pumps, EV chargers, and dynamic electricity tariffs.
HEMS is important in the wider energy system, but it is not the main focus for industrial platforms. Smart RDM and similar industrial data platforms usually target industrial and enterprise use cases rather than residential energy management.
Grid-level EMS
Grid-level energy management systems help utilities, microgrid operators, or distributed energy resource operators manage supply, demand, storage, and grid stability.
IEC 61968 is relevant in this context because it addresses information exchange between electrical distribution systems and supports inter-application integration for utility distribution management.
Key components of an energy management system
An EMS combines measurement devices, data infrastructure, analytics, controls, dashboards, and management processes.
The components below appear in most mature implementations.
| Component | Examples | Role in EMS |
| Metering | smart meters, sub-meters, interval meters, AMR | measures energy consumption |
| Sensors | temperature, pressure, flow, occupancy, power quality | adds operational and environmental context |
| Data acquisition | gateways, PLC interfaces, BMS/SCADA connectors | collects and transmits data |
| Data storage | historian, database, cloud platform, lakehouse | stores time-series and contextual data |
| Analytics software | dashboards, EnPIs, alerts, reports, forecasting | turns raw data into insight |
| Control systems | BMS, SCADA, PLC, EMS control logic | executes control or optimization actions |
| Dashboards | energy maps, load profiles, KPIs, benchmarks | supports operational decisions |
| Reporting | ISO 50001, ESG, carbon, utility, cost reports | provides management and compliance evidence |
| Integration | MES, ERP, SCADA, BMS, PLC, IoT, smart meters | connects energy with operations |
| Management process | policy, review, targets, responsibilities, audits | ensures continual improvement |
Smart meters and sub-metering are especially important. Many organizations cannot improve energy performance because they do not know where energy is consumed. Sub-metering allows consumption to be mapped to assets, lines, areas, systems, or products.
Interval data is also useful. A monthly bill tells you total consumption. Fifteen-minute interval data can reveal peaks, idle loads, start-up patterns, weekend waste, and demand charges. For industrial sites, this granularity is often the difference between reporting and actionable analysis.
Energy monitoring and metering
Energy monitoring provides the data foundation for an EMS; without reliable metering, energy performance cannot be measured or improved consistently.
Energy monitoring usually includes:
- smart meters,
- automatic meter reading,
- sub-metering,
- real-time data,
- interval data, often 15-minute readings,
- power quality monitoring,
- load profiling,
- utility bill integration,
- alarm thresholds.
A simple EMS may start by tracking electricity, gas, and water consumption at site level. A more advanced system tracks consumption by department, line, machine, utility system, product, batch, and time interval.
Power quality is another important dimension. Voltage disturbances, harmonics, imbalance, low power factor, and transient events can affect equipment reliability, energy cost, and process stability. Schneider Electric describes EcoStruxure Power Monitoring Expert as power monitoring software for high energy-demand facilities, with capabilities for power quality, reliability, efficiency, compliance, reporting, and ISO 50001-related analysis.
The practical rule is simple: meter at the level where decisions are made. If maintenance teams need to manage compressed air, meter compressed air. If production leaders need to compare lines, meter by line. If finance needs energy cost per unit, connect energy data with production output.
ISO 50001 and the EMS framework
ISO 50001 defines a formal framework for implementing an energy management system and improving energy performance through a continual improvement cycle.
ISO 50001 is built around the Plan-Do-Check-Act approach. The standard helps organizations establish energy policy, conduct energy reviews, define baselines, track EnPIs, set objectives, implement actions, monitor results, and continually improve energy performance. ISO states that ISO 50001 provides a framework for integrating energy performance into management practices and sustaining improvement over time.
Plan
The organization defines its energy policy, conducts an energy review, identifies significant energy uses, establishes baselines, selects EnPIs, and sets objectives and targets.
The DOE’s ISO 50001 eGuide explains that energy planning develops a profile of the organization’s energy situation based on energy data and other organizational data, and that ISO 50001 requires energy planning to lead to actions that improve energy performance.
Do
The organization implements action plans, assigns responsibilities, provides resources, trains people, operates controls, and manages processes that affect energy performance.
Check
The organization monitors performance, tracks EnPIs, compares results with baselines, evaluates significant energy uses, conducts internal reviews, and verifies whether actions are working.
Act
The organization reviews performance and updates policies, targets, processes, and improvement actions. This is what turns energy management into a continual process rather than a one-time savings project.
EnPIs and energy baseline
Energy Performance Indicators, or EnPIs, are the metrics used to evaluate energy performance. Examples include:
- kWh per unit produced,
- kWh per batch,
- kWh per square meter,
- energy cost per unit output,
- compressed air kWh per production hour,
- steam consumption per tonne,
- energy efficiency ratio,
- peak demand per production volume.
An Energy Baseline, or EnB, provides the reference point for measuring improvement. The DOE explains that EnPIs can be single metrics, ratios, or models and that improvement is determined by comparing current EnPIs against relevant energy baselines.
This matters because absolute energy consumption is often misleading. A factory producing twice as much may consume more total energy while becoming more energy efficient per unit. That is why energy intensity is often more useful than total kWh alone.
Energy audits and EN 16247
Energy audits identify energy-saving opportunities; an EMS helps track, implement, and verify those opportunities over time.
An energy audit is typically a structured assessment of energy use, significant energy consumers, inefficiencies, and improvement opportunities. It may identify actions such as repairing compressed air leaks, optimizing HVAC schedules, improving insulation, replacing inefficient motors, correcting power factor, recovering heat, or changing operating procedures.
EN 16247 is an important European standard family for energy audits. It provides requirements for energy audit processes across buildings, industrial processes, and transport. In an EMS context, audits are useful because they create a pipeline of improvement opportunities.
However, an audit alone is not an EMS. An audit identifies opportunities. An EMS helps manage the ongoing cycle of measurement, prioritization, implementation, verification, and continual improvement.
Energy Performance Indicators (EnPIs)
Energy Performance Indicators are the metrics an EMS uses to track whether energy performance is improving.
Good EnPIs must be aligned with how the organization operates. A single global kWh number is rarely enough.
Common EnPIs include:
| EnPI | Where it is useful |
| kWh per unit produced | manufacturing lines, assembly, packaging |
| kWh per tonne | process industries, steel, food processing |
| kWh per batch | batch manufacturing, pharma, chemicals |
| energy cost per unit output | finance and operations |
| peak demand per production volume | demand charge management |
| compressed air kWh per operating hour | utilities and maintenance |
| HVAC kWh per occupied area | buildings and campuses |
| energy intensity by product | product-level energy analysis |
| standby load | idle equipment and weekend waste |
| power factor | electrical efficiency and utility penalties |
The DOE notes that EnPIs can be established at different levels of an energy management system, including organization, facility, equipment, system, or process level.
In manufacturing, EnPIs should often be normalized against production output, product mix, operating hours, weather, or other relevant variables. Without normalization, teams may misinterpret changes in consumption.
For example, if total energy use increased by 8% while output increased by 20%, energy performance may have improved. If total energy use stayed flat while output decreased by 15%, energy intensity may have worsened. EnPIs make that visible.
EnPIs are related to production KPIs, but a full production performance framework belongs in a dedicated manufacturing performance guide.
Demand response and peak load management
An EMS can automate demand response, peak shaving, load shifting, and time-of-use optimization.
Peak demand often drives a significant part of industrial and commercial energy cost. A facility may pay not only for total kWh consumed, but also for the highest power demand reached during a billing period. An EMS can help reduce this cost by identifying and controlling peak loads.
Common strategies include:
- staggering equipment start-up,
- shifting flexible loads to off-peak periods,
- pre-cooling or pre-heating buildings,
- adjusting HVAC schedules,
- managing battery storage,
- coordinating EV charging,
- curtailing non-critical loads,
- rescheduling energy-intensive production,
- participating in demand response programs.
Demand response means adjusting consumption in response to grid signals, tariffs, or utility programs. Peak shaving reduces the maximum load drawn from the grid. Load shifting moves consumption from expensive or constrained periods to lower-cost periods.
These actions require operational constraints. In manufacturing, the EMS cannot simply turn off critical equipment without production context. That is why industrial EMS must connect energy data with production schedules, asset status, and process requirements.
Benefits of energy management systems
Energy management systems reduce energy cost, improve operational visibility, support compliance, and provide data for emissions and ESG reporting.
Reported outcomes vary by site, scope, maturity, and baseline condition. Honeywell materials cite 10–30% energy savings in energy management and building-energy contexts, including a case reporting more than 30% energy cost savings in the first eight months of use.
| Benefit | How EMS contributes | Typical metric |
| Energy cost reduction | identifies waste, peak loads, inefficient operation | 10–30% reported savings range in many EMS contexts |
| Operational visibility | shows energy by asset, line, building, or process | kWh, load profile, peak demand |
| Regulatory compliance | supports ISO 50001, audits, energy reporting | audit evidence, EnPIs, baselines |
| Carbon footprint reduction | provides energy data needed for emissions calculations | energy-based CO₂ reporting |
| Demand cost reduction | supports peak shaving and load shifting | peak kW, demand charges |
| Maintenance insight | detects inefficient equipment behavior | abnormal consumption, power quality issues |
| Production-energy correlation | links energy to output, batch, product, or shift | kWh/unit, kWh/batch |
| ESG reporting support | feeds reliable energy data into reporting processes | energy, emissions, intensity indicators |
| ROI tracking | verifies savings from projects | payback period, cost per kWh saved |
Payback periods vary. In many industrial and building projects, payback can range from one to three years when EMS implementation is linked to measurable savings actions, tariff optimization, controls, and operational changes. The payback depends heavily on energy prices, existing metering, control capability, and how much waste exists before implementation.
Carbon emissions tracking can be enabled by EMS data, but emissions accounting and carbon reporting should be covered in a dedicated carbon emissions tracking guide. ESG reporting can use EMS data, but broader ESG data management belongs in a separate ESG data management guide.
EMS in manufacturing
An industrial EMS helps manufacturers understand how energy consumption relates to machines, lines, products, shifts, batches, and production output.
Manufacturing energy use is often hidden inside utility systems and production processes. Electricity, compressed air, steam, gas, cooling, water, and heat are consumed across many assets. Without an EMS, teams may see total plant energy use but not know which process, line, product, or operating condition caused the change.
Industrial EMS use cases include:
- energy monitoring by production line,
- kWh per unit or batch,
- compressed air leakage detection,
- steam trap monitoring,
- chiller optimization,
- oven and furnace energy tracking,
- peak load management,
- product-level energy costing,
- standby consumption detection,
- comparison across shifts or plants,
- energy allocation to cost centers,
- support for ISO 50001,
- data for ESG and carbon reporting.
Siemens describes SIMATIC Energy Manager as software that records energy and media usage, integrates data from machines, SCADA, BMS, ERP, and MES, supports OPC UA, Modbus TCP, and MQTT, and provides data for sustainability and ESG reporting.
This industrial context is important. Energy management in manufacturing is not only about lowering the electricity bill. It is also about linking energy use with operating conditions. A production line may consume more energy because of a process fault, poor equipment condition, inefficient settings, or a change in product mix.
Predictive maintenance and condition monitoring can reveal equipment inefficiencies that increase energy use, but maintenance methods should be covered in dedicated predictive maintenance and condition monitoring guides.
EMS and industrial data integration
An EMS becomes more valuable when it connects energy data with operational data from SCADA, BMS, PLC, MES, ERP, IoT sensors, and smart meters.
Typical integration points include:
| System | EMS value |
| SCADA | process values, machine states, alarms, utility systems |
| BMS/BEMS | HVAC, lighting, building zones, occupancy |
| PLC | equipment status, load, cycle, runtime |
| MES | orders, products, batches, output, line status |
| ERP | cost centers, tariffs, product master data, finance |
| IoT sensors | additional metering, temperature, pressure, flow |
| Smart meters | interval consumption, billing data, peak demand |
| CMMS | maintenance events, equipment history, efficiency actions |
This is where an industrial data platform can support EMS by connecting OT and IT data, contextualizing energy measurements, and making energy data available to analytics, reporting, and operational applications.
Manufacturing analytics can consume EMS data to analyze trends and correlations, but analytics methods belong in a dedicated manufacturing analytics guide. AI and machine learning can support forecasting, anomaly detection, and automated optimization, but AI for operations should remain a separate AI for operations guide.
Energy management system software: what to look for
Energy management system software should collect energy data, calculate performance indicators, generate reports, support control actions, and help users verify savings.
A useful EMS software selection checklist includes:
| Capability | Why it matters |
| Multi-utility monitoring | electricity, gas, steam, water, compressed air, heat |
| Smart meter and sub-meter support | enables granular tracking |
| Real-time and interval data | supports load profiling and peak analysis |
| Dashboards | makes consumption visible to operators and managers |
| EnPI calculation | tracks energy performance against ISO 50001-style indicators |
| Baseline management | measures improvement against reference conditions |
| Alerts | flags abnormal consumption or peak risk |
| Demand response support | enables load shifting and curtailment |
| Control integration | connects insight to automated or manual actions |
| Reporting | supports audits, ISO 50001, ESG, carbon, finance |
| Integration | SCADA, BMS, PLC, MES, ERP, IoT, smart meters |
| Role-based access | shows relevant data to each user group |
| Cost allocation | assigns energy cost to lines, areas, products, or tenants |
| Power quality analysis | supports reliability and electrical system management |
| Savings verification | tracks impact of improvement measures |
A common mistake is choosing EMS software based only on dashboard appearance. The harder questions are about data quality, integration, baselines, EnPIs, control actions, user ownership, and whether the system can support long-term improvement.
How to choose an energy management system
Choosing an EMS requires matching the system to the site type, energy profile, metering maturity, control requirements, and organizational goals.
A practical selection process should address the following questions.
1. What is the main use case?
The EMS for a factory, hospital, office tower, data center, or home will not be the same. Define the primary use case:
- ISO 50001 implementation,
- energy cost reduction,
- peak demand reduction,
- manufacturing energy intensity,
- building HVAC optimization,
- ESG reporting support,
- carbon data collection,
- utility or grid flexibility,
- data center power monitoring.
2. What needs to be measured?
List utilities and major consumers:
- electricity,
- gas,
- steam,
- compressed air,
- chilled water,
- hot water,
- process heat,
- HVAC,
- production lines,
- major motors,
- furnaces,
- chillers,
- data center loads.
3. What integrations are required?
An EMS that cannot connect to existing SCADA, BMS, PLC, MES, ERP, IoT sensors, or smart meters may become a separate reporting tool rather than part of operations.
4. What level of control is needed?
Some organizations need monitoring and reporting only. Others need automated control, demand response, load shedding, peak shaving, or optimization.
5. What compliance requirements apply?
If ISO 50001 is the target, the EMS should support energy review, EnPIs, baselines, targets, action tracking, and management review. If ESG reporting or carbon tracking is required, data lineage and evidence become more important.
6. Who will use the system?
Different users need different views:
- energy manager,
- facility manager,
- production manager,
- maintenance engineer,
- finance,
- sustainability team,
- plant manager,
- operator,
- corporate ESG team.
A strong EMS should support both technical and management users.
Vendor landscape 2026
The energy management system market includes energy management system manufacturers, service providers, software vendors, building automation companies, industrial automation vendors, home energy platforms, and institutional guidance sources. The following list is neutral and informational, not a ranking.
| Vendor / source | Positioning | Typical role |
| Energy Management Systems Inc. | Energy management service provider | EMS services and energy management support |
| Wikipedia | Encyclopedia-level overview | General reference |
| Honeywell | Building, enterprise, carbon and energy management solutions | Building and enterprise EMS, optimization, controls |
| gridX | EMS education and distributed energy resource management | HEMS and DER-focused EMS context |
| Emporia Energy | Consumer home energy management | HEMS, smart devices, home energy monitoring |
| MRI Software | Property and building energy management content | Real estate and building EMS context |
| UNIDO | Institutional EnMS guidance | ISO 50001, industrial energy efficiency, capacity building |
| Siemens | SIMATIC Energy Manager and industrial energy management | Industrial EMS, IT/OT integration, production-energy context |
| Schneider Electric | EcoStruxure Power Monitoring Expert and energy management software | Power monitoring, buildings, data centers, industry |
| Smart RDM | Industrial Data & AI Platform | Industrial data integration, energy analytics, reporting, and operational decision support |
Honeywell publishes carbon and energy management materials that reference AI/ML for optimizing HVAC equipment performance, while Siemens and Schneider Electric position their systems around industrial or power monitoring, energy data transparency, and operational energy analysis.
A vendor choice should be based on the operating environment. A building owner may prioritize HVAC and occupancy control. A manufacturer may prioritize SCADA/MES integration and energy per unit. A utility or grid operator may prioritize interoperability, demand response, and distributed energy resource management.
Implementation roadmap
An EMS implementation should start with energy data quality, clear objectives, and a practical improvement loop.
A typical roadmap includes eight stages.
Step 1: Define objectives
Clarify the main purpose:
- reduce energy cost,
- support ISO 50001,
- reduce peak demand,
- improve energy intensity,
- support ESG reporting,
- track carbon-related data,
- improve utility system performance,
- compare plants or lines.
Step 2: Establish the energy team
Energy management requires ownership. The team may include energy managers, facility managers, production, maintenance, finance, sustainability, automation, IT, and management representatives.
Step 3: Conduct an energy review
Identify significant energy uses, key systems, major loads, operating patterns, tariffs, and improvement opportunities. This step aligns with ISO 50001 energy planning.
Step 4: Build the metering plan
Decide what must be metered at site, building, line, process, and asset level. Prioritize metering where decisions will be made.
Step 5: Define EnPIs and baselines
Select indicators that reflect real operations. Establish baselines so improvement can be measured. Use normalized EnPIs where output, weather, occupancy, or product mix affects consumption.
Step 6: Deploy EMS software and integrations
Connect meters, sensors, SCADA, BMS, PLC, MES, ERP, smart meters, and other sources. Build dashboards for different users.
Step 7: Implement actions
Use insights to reduce waste, adjust schedules, manage peaks, correct inefficient operation, optimize equipment, and support demand response.
Step 8: Verify and improve
Track savings, compare against baselines, review EnPIs, validate actions, and update targets. This closes the ISO 50001-style improvement loop.
Automated workflows can help route alerts and actions to the right teams, but digital workflow design should be handled in a dedicated digital workflows guide.
Common EMS implementation mistakes
Energy management system projects often fail when they focus on dashboards but not decisions.
Too little metering
A single main meter is not enough for operational energy management. Without sub-metering, the system may show that consumption increased but not why.
No production context
In manufacturing, energy data without production output can be misleading. Energy intensity, not just total kWh, is often the more useful metric.
Unclear baselines
Without a baseline, savings claims are difficult to verify. Baselines should consider production volume, weather, occupancy, operating hours, and other relevant variables.
Ignoring peak demand
Many organizations focus on total consumption and miss demand charges. Peak load management can be one of the strongest EMS business cases.
No ownership
If no one owns energy performance, dashboards become passive reports. EMS requires defined roles, review cycles, and action owners.
Treating ISO 50001 as paperwork
ISO 50001 is most useful when it changes management practice, not when it becomes a document exercise. The system should connect policy, review, EnPIs, action plans, and results.
No verification of savings
Energy-saving actions should be tracked against baselines. Otherwise, teams cannot distinguish real savings from weather, production changes, or operational variation.
Energy management system examples
Manufacturing plant
A factory installs sub-meters on major production lines, compressors, chillers, and ovens. The EMS calculates kWh per unit and identifies one line with higher energy intensity than similar lines. Maintenance finds compressed air leakage and incorrect standby operation during breaks.
Commercial building
A building uses BEMS functions to control HVAC and lighting based on occupancy and schedules. The EMS detects unnecessary weekend HVAC operation and adjusts schedules to reduce consumption without affecting comfort.
Data center
A data center monitors power quality, UPS load, cooling energy, and peak demand. The EMS supports reliability, capacity planning, and efficiency reporting.
Food and beverage plant
A production site tracks steam, compressed air, chilled water, and packaging-line electricity. The EMS links energy use to batches and identifies high energy consumption during cleaning and changeover.
Home energy management
A HEMS coordinates solar PV, battery storage, EV charging, and dynamic tariffs. The system shifts charging and consumption toward lower-cost periods and increases self-consumption of solar generation.
Utility or grid EMS
A grid-level EMS supports demand response, distributed energy resource coordination, and peak load reduction. IEC 61968-type integration becomes relevant where utility applications need interoperable data exchange.
EMS, ESG, and carbon data
An EMS provides energy data that can support ESG reporting and carbon emissions tracking, but it is not the same as a full ESG or carbon management system.
Energy data is often the starting point for Scope 1 and Scope 2 emissions calculations. Electricity, gas, steam, and fuel consumption can be converted into emissions using location-based or market-based emission factors.
However, carbon emissions tracking requires additional rules, emission factors, organizational boundaries, reporting periods, and audit evidence. That topic should be covered in a dedicated carbon emissions tracking guide.
Similarly, ESG data management includes energy, carbon, water, waste, social indicators, governance processes, and reporting workflows. EMS data can feed ESG systems, but ESG data management is broader than energy management.
FAQ
What is an energy management system?
An energy management system is a combination of hardware, software, controls, and management processes used to monitor, analyze, control, and optimize energy consumption.
What is EMS energy management system?
EMS stands for Energy Management System. In industrial and building contexts, it usually refers to a system that collects energy data, calculates performance indicators, supports reporting, and helps reduce energy cost and consumption.
How does an energy management system work?
An EMS collects data from meters, sensors, SCADA, BMS, PLCs, smart meters, and other systems. It processes the data into EnPIs, dashboards, reports, and alerts, then supports control or optimization actions.
What are examples of energy management systems?
Examples include industrial energy management systems for factories, building energy management systems for HVAC and lighting, home energy management systems for solar and EV charging, and grid-level EMS for utilities or microgrids.
What are the four types of energy management systems?
The four common types are Industrial Energy Management Systems, Building Energy Management Systems, Home Energy Management Systems, and grid-level or utility energy management systems.
What is an ISO 50001 energy management system?
An ISO 50001 energy management system is an EnMS implemented according to the ISO 50001 framework. It includes energy policy, energy review, EnPIs, energy baselines, objectives, action plans, monitoring, review, and continual improvement.
What is a building energy management system?
A building energy management system is an EMS focused on building energy loads such as HVAC, lighting, ventilation, occupancy-based controls, and building services. It often overlaps with BMS.
What is an industrial energy management system?
An industrial energy management system monitors and optimizes energy use in manufacturing or process environments. It often tracks electricity, gas, steam, compressed air, water, and energy per unit of production.
What is a home energy management system?
A home energy management system monitors and controls residential energy use, often coordinating smart devices, solar panels, batteries, EV charging, heat pumps, and dynamic tariffs.
What is energy management system software?
Energy management system software collects, stores, visualizes, and analyzes energy data. It may include dashboards, EnPIs, baselines, alerts, demand response, peak management, reporting, and integration with operational systems.
What are the benefits of an energy management system?
Benefits include energy cost reduction, better operational visibility, peak demand management, ISO 50001 support, compliance reporting, carbon data support, energy intensity reduction, and improved decision-making.
How much can an EMS reduce energy costs?
Reported results vary, but EMS and structured energy management programs commonly target or report energy cost or consumption reductions in the 10–30% range, depending on the site, baseline, controls, and implementation quality.
What are EnPIs?
EnPIs are Energy Performance Indicators. They are quantitative metrics used to measure energy performance, such as kWh per unit, kWh per square meter, energy cost per output, or energy intensity.
What is an energy baseline?
An energy baseline is a reference point used to compare current and future energy performance. It helps verify whether an energy-saving action actually improved performance.
What is peak shaving?
Peak shaving is the practice of reducing maximum power demand during peak periods. It can lower demand charges and reduce stress on the grid.
What is demand response?
Demand response means adjusting energy consumption in response to grid needs, utility signals, tariffs, or incentives. An EMS can automate or support demand response actions.
What systems does EMS integrate with?
An EMS can integrate with SCADA, BMS, PLC, MES, ERP, IoT sensors, smart meters, historians, CMMS, and reporting platforms.
Can EMS support ESG reporting?
Yes. EMS data can support ESG reporting by providing reliable energy consumption data. Full ESG data management includes additional environmental, social, and governance data beyond EMS.
Can EMS support carbon emissions tracking?
Yes. EMS energy data can feed carbon emissions calculations, especially for electricity, gas, steam, and fuel use. Carbon accounting itself requires separate emission factors, boundaries, and reporting rules.
How do you implement an energy management system?
Implementation usually involves defining objectives, forming an energy team, conducting an energy review, deploying metering, defining EnPIs and baselines, integrating data sources, implementing actions, and reviewing results.
Conclusion
An energy management system helps organizations move from energy reporting to energy control. It collects energy data, turns it into performance indicators, compares results against baselines, and supports actions that reduce consumption, cost, and waste.
For buildings, EMS often focuses on HVAC, lighting, occupancy, and comfort. For industry, the strongest use cases are usually production-energy correlation, compressed air, steam, electrical systems, peak demand, and energy per unit output. For homes, EMS coordinates smart devices, solar, storage, and tariffs. For utilities, EMS supports demand response and grid-level optimization.
The most effective EMS implementations combine technology with management discipline. Meters and dashboards provide visibility. ISO 50001 provides structure. EnPIs and baselines provide measurement. Control actions and operating routines create improvement.
For manufacturers, the key is to connect energy data with production context. When energy consumption can be linked to machines, lines, batches, products, shifts, and operating states, energy management becomes part of daily operations rather than a monthly report.

Light mode